Section 2:
Experimental Studies to Determine the Effectiveness of LAPC under Laboratory Conditions
 Experimental Studies to Determine the Effectiveness of LAPC under Laboratory Conditions
[This section is an edited version of an article authored by Steven B. Harris, Michael G. Darwin, Sandra R. Russell, Joan M. O’Farrell, Mike Fletcher and Brian Wowk entitled, Rapid (0.5°C/min) minimally invasive induction of hypothermia using ~4ºC perfluorochemical lung lavage in dogs, which first appeared in Resuscitation, 2001. 50: p. 189-204.)]
1. Introduction
The potential utility of profound and ultra-profound hypothermia (0-5oC ) to arrest deleterious neurological changes has long been understood in both biology and medicine.[168],[169],[170],[171],[172] In 1959 Benson, et al., reported good outcome using profound hypothermia (10-22oC ) as a treatment following cardiac arrest. [173] This work was followed up by a number of clinicians [168],[174],[175],[176] who also reported favourable results. However, due to coagulopathy, arrhythmias, and the increased incidence of pneumonia and sepsis associated with such deep and prolonged cooling, post arrest hypothermia failed to gain acceptance and was abandoned. It was not until the work of Safar, et al., [160],[53],[82] that the utility of mild therapeutic hypothermia (MTH) (DT = −2 to −3°C) as an active treatment for the post-resuscitation syndrome was rigorously demonstrated, and subsequently validated by others. [177],[178],[55],[179-181] As noted in Section 1, while CPB offers the most rapid core cooling possible, it is logistically unsupportable as currently practiced. Additionally, CPB carries the added risks of anticoagulation, further activation of the immune-inflammatory cascade, RBC aggregation, and the danger of gas embolism, as chilled, nitrogen-saturated blood is rapidly re-warmed as it perfuses warm tissues.[182]
As was also previously noted, less invasive modalities with the potential for in-field application, such as surface cooling and lavage of body viscuses with a balanced salt solution, are only effective in achieving cooling rates in the range of 0.10–0.15°C/min. The seemingly straightforward experimental technique of ‘tidal liquid ventilation’ (TLV) with chilled, oxygenated PFC uses the ~20 m2 surface area of the lungs for heat exchange, but thus far has been no more effective in inducing hypothermia than surface cooling with ice bags or chilled water blankets.[155] After preliminary experiments demonstrated the technical adequacy of LAPC at achieving heat exchange in range of 0.25 to 0.35°C/min [183] a comprehensive study was undertaken by 21st Century Medicine Inc., (21CM) and Critical Care Research, Inc., (CCR), beginning in 1999, to define and validate this cooling modality in a canine model. The goals of this research were to, a) demonstrate the fundamental safety and efficacy of the technique, b) determine the optimum cycle and volume of liquid and gas fractional tidal liquid ventilations (FTLVs), and c ) attempt to determine safe airway pressures and define liquid and gas ventilation strategies that minimized or eliminated baro- and volutrauma.
This technique, developed at 21CM/CCR, was initially called ‘mixed-mode liquid ventilation cooling’ and was later renamed ‘gas-liquid ventilation’ (GLV). However, neither of these names adequately describes the technique, and this author (Darwin) has chosen to the use the term liquid assisted pulmonary cooling (LAPC) instead. In previous studies where large fractional tidal liquid volumes and shorter cycles of FTLV were used, the performance of LAPC deteriorated towards that seen when TLV-cooling (or warming) was used. In practice however, certain significant differences remained and understanding these differences proved essential to optimization of the technique.
In LAPC the critical elements of gas ventilation are retained allowing for flexibility in selecting ventilation parameters independently for heat and gas-exchange, allowing for liquid-mediated heat-exchange to be easily undertaken using existing ventilation systems[1]. The combination of gas and liquid FTLVs may also play a role in the surprisingly good thermal efficiency of LAPC as compared with TLV.
The following study explored the performance of LAPC using a prototype automated FTLV device, and discussed the basic mechanics and intrinsic limitations of heat-exchange using FTLV.
2. Materials and methods
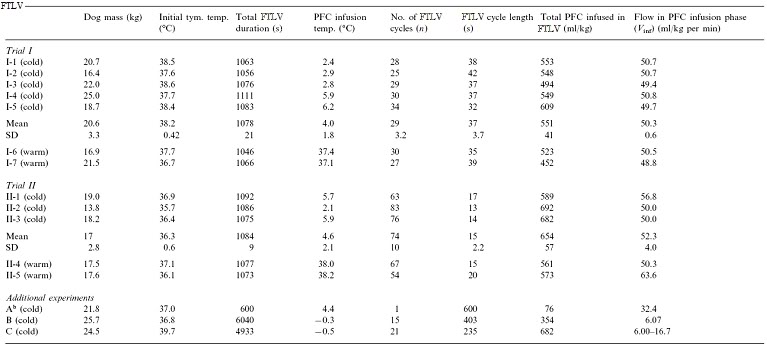
These experiments were approved by 21st Century Medicine, Inc.’s Institutional Animal Care and Use Committee and were in compliance with the Animal Welfare Act and the National Research Council’s Guide for the Care and Use of Laboratory Animals. Fifteen mongrel dogs weighing 13.8–25.7 kg were used (Table 1). Dogs were pre-medicated with I.M. acepromazine (1.0 mg/kg) and atropine (0.02 mg/kg) prior to induction of general anesthesia using sodium pentobarbital (30 mg/kg I.V., with maintenance dosing). Anesthetized dogs were intubated with a reinforced 10.0 mm I.D. (Willy Rusch AG, Kernen, Germany) endotracheal tube (E.T.), and ventilated on room air using a Bennett MA1 or Siemens Servo 900 C ventilator. Ventilator parameters, unless otherwise noted, were 12 gas-breaths/min, gas tidal-volume of 15 ml/kg, I:E ratio of 1:3, and a maximal positive inspiratory pressure (PIP) limit of 26 cm H2O (2.5 kPa). Gas pressures were measured at the E.T. adapter. Gas minute-volume (Vg) was adjusted to maintain PaCO2 between 35 and 40 torr. Animals were maintained at ~37.5°C prior to LAPC, using a temperature-controlled water blanket. Rectal and bilateral tympanic temperatures (Ttym) were monitored continuously using a type-T thermocouple system (Cole-Parmer, Vernon Hills, IL) with a response time constant (to) of 5 s.
Combination pressure, blood sampling, and temperature-probe catheters were constructed from rigid polyethylene pressure-monitoring catheters, threaded centrally with 0.05 in. O.D. Teflon™-sheathed type-T thermocouples (to=0.3 s, Physitemp Instruments, Clifton, NJ). In order to reduce the risk of catheter-associated clot formation, I.V. sodium heparin was given to adjust activated clotting times to 300–500 s, prior to central line placement. Femoral vessels were isolated surgically, and arterial and venous catheters placed and advanced to a level above the renal vessels, as confirmed by X-ray. During surgery, bupivacaine (0.5%) was infiltrated into wounds to mitigate post-operative pain.
In one dog (Trial I-2), a femorally-placed pulmonary artery thermodilution catheter replaced the venous combination catheter. Blood and ventilator pressures were acquired through a Hewlett Packard 78532-B monitor/transducer system.
Immediately prior to LAPC, dogs were assessed for adequacy of general anesthesia, and then given pancuronium bromide (2 mg) to inhibit shivering and spontaneous breathing. FIO2 was increased to 100% and external temperature control discontinued. To serve as a cannula for both delivery and removal of PFC liquid, a 19-Fr. flat-wire reinforced Bio-Medicus® venous catheter (Medtronic, Eden Prairie, MN) was introduced through the suction port of the E.T. adapter, and advanced ~45 cm to approximately the level of the carina (Figures 2-1 and 2-2) as confirmed by X-ray. This cannula was connected to the LAPC apparatus described below. LAPC was performed using the PFC liquid ‘FC-75’ (3M Corporation, St. Paul, MN), a perfluorinated butyl-tetrahydrofuran isomer mixture.[184]
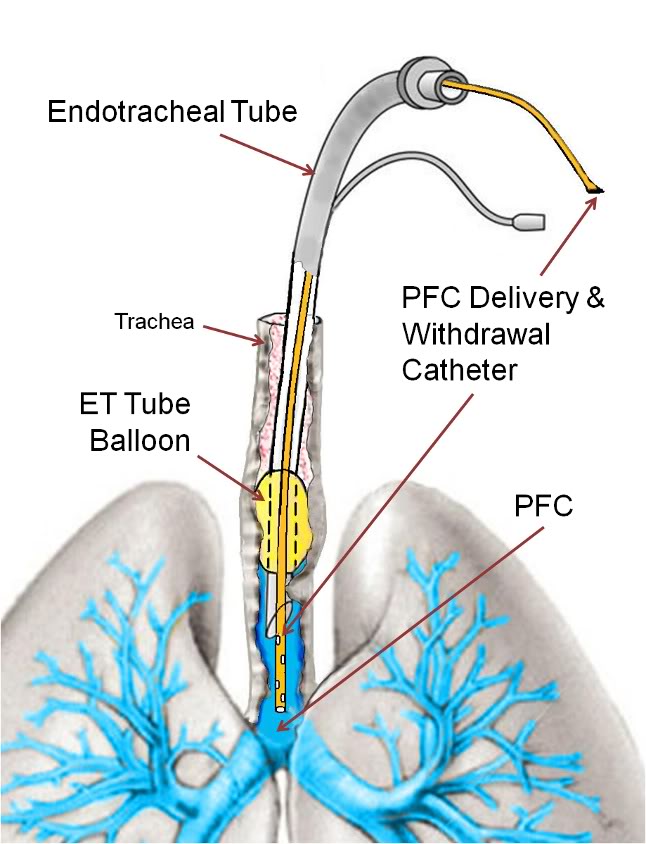 Figure 2-1 (right): PFC delivery and withdrawal catheter threaded through the endotracheal tube with the tip positioned at the level of the carina.
A two reservoir circuit (Figure 2-3) was used to deliver and remove PFC from the lungs (FTLV) via the cannula, in cycle periods of 37 s (Trial I) or 16 s (Trial II). During timed PFC infusions (tin=20 s for Trial I, or 10 s for Trial II), PFC was pumped through the cannula by a continuously-operating Travenol CPB roller-pump (Sarns, Ann Arbor, MI). A bypass loop, open during suction, allowed the roller-pump to divert (recirculate) PFC flow back into the storage reservoir whenever flow was not directed by line clamps V1–V3 into the animal. PFC was pumped continuously through an in-line 0.2 μ ‘pre-bypass’ filter (Pall PP 3802, Pall, East Hills, NY), a primary heat-exchanger (Torpedo-T, Sarns, Ann Arbor, MI), and a combination silicone membrane oxygenator/heat-exchanger (SciMed II-SM35, SciMed Life Systems, Minneapolis, MN). The oxygenator was supplied with 5–6.5 l/min O2 (maximal device design rate), and the reservoir PFC was allowed to circulate and equilibrate with heat-exchangers and O2, before LAPC was initiated. The circuit tubing was constructed of S-50 HL TYGON® 3/8 and 1/2 in. I.D. class VI tubing (Norton/Performance Plastics, Akron, OH) with the exception of a length of silicone tubing (Masterflex® 96410-73, Barrant Co., Barrington, IL) used in the roller-pump head in order to allow flexibility at low temperatures. PFC suction was driven by a vacuum pump (model 107CAB18B, Thomas Compressors, Sheboygan, WI), and suction reservoir negative pressure was limited to −35 torr by a vacuum relief valve. 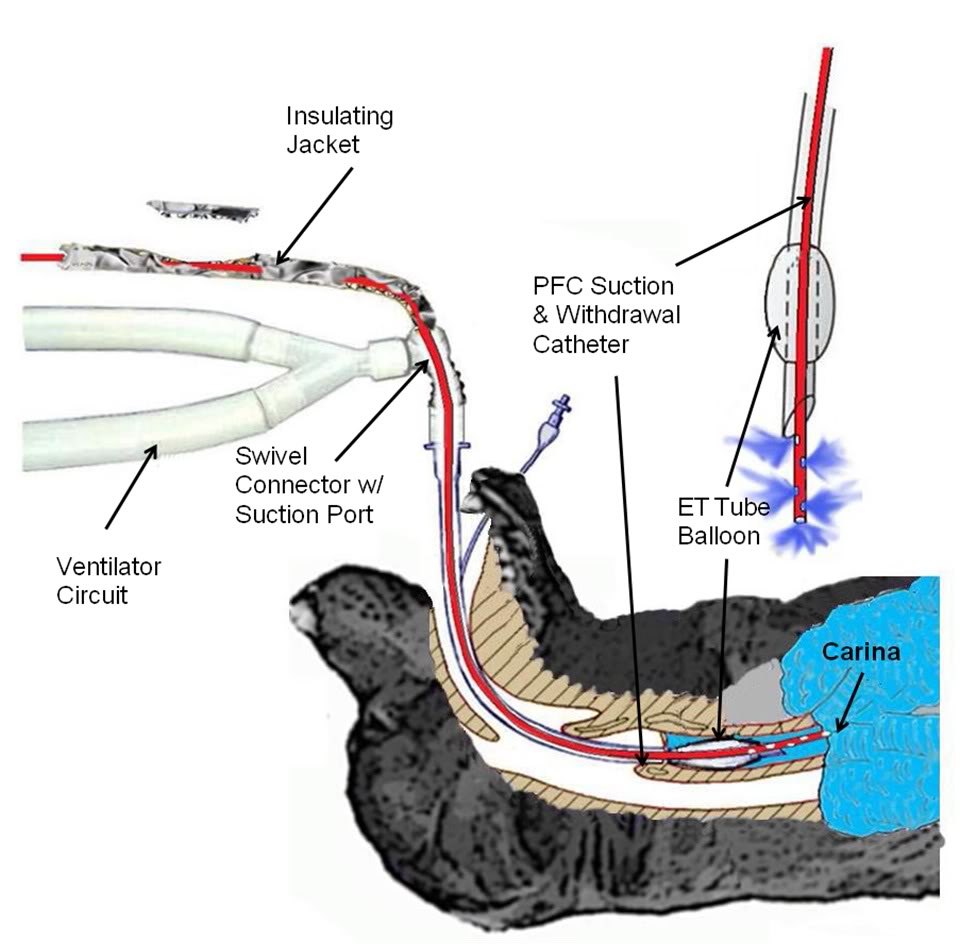 Figure 2-2: Detail of LAPC PFC introduction and removal catheter and ET Tube and gas ventilator configuration. A Biomedicus CPB venous return catheter was threaded through the suction port of a standard 16 mm respiratory ET tube swivel connector.
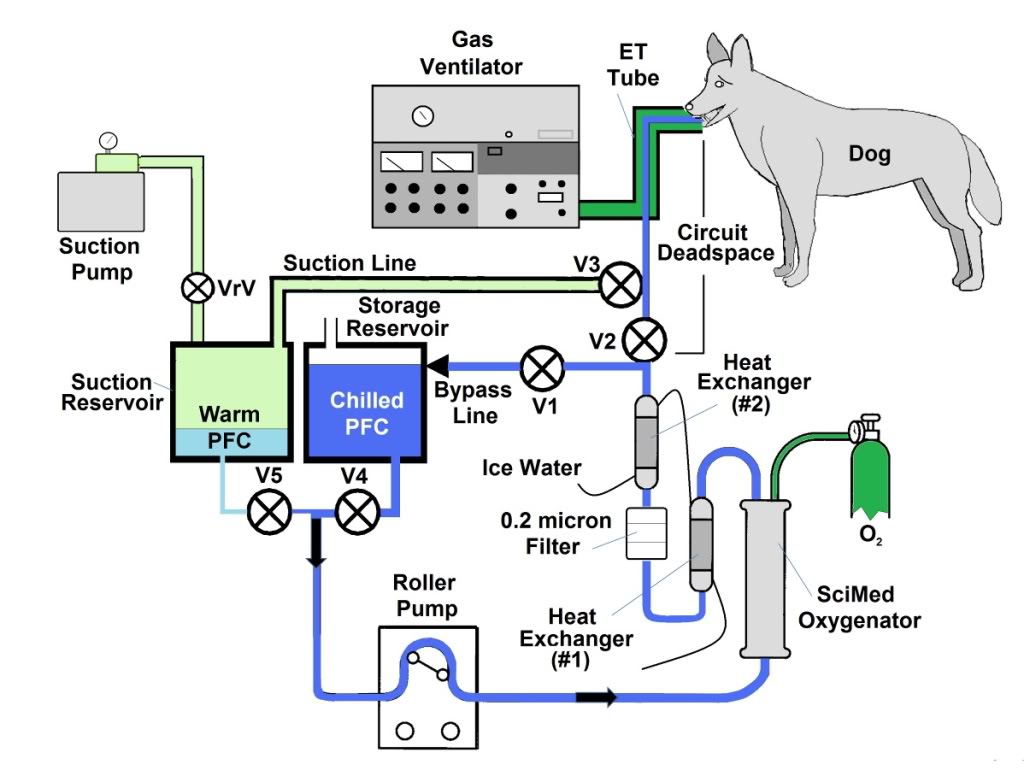
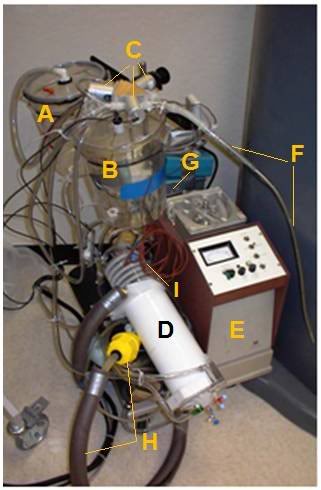
Figure 2-3: The LAPC system. The LAPC system was connected to a catheter inserted into the suction port of the E.T. adapter. PFC flows were directed by manual or mechanical clamps at V1–3. During the suction phase, FC from the lungs was removed into a sealed ‘suction’ reservoir, for later addition to the primary circuit (via adjustment of V4 and V5), while ‘infusion ready’ PFC was re-circulated through a bypass loop. Negative pressure was limited by a vacuum relief valve (VrV). Photo (right) A) Suction Reservoir, B) Storage Reservoir, C) Solenoid Valves (V1-V3), D) SciMed Oxygenator & Heat Exchanger, E)Sarns Roller Pump, F) PFC Suction/Delivery Catheter, G) Pump Controller, H) Heat Exchanger Return Line with weighted water diffuser (yellow), I) Thermocouple Probes.
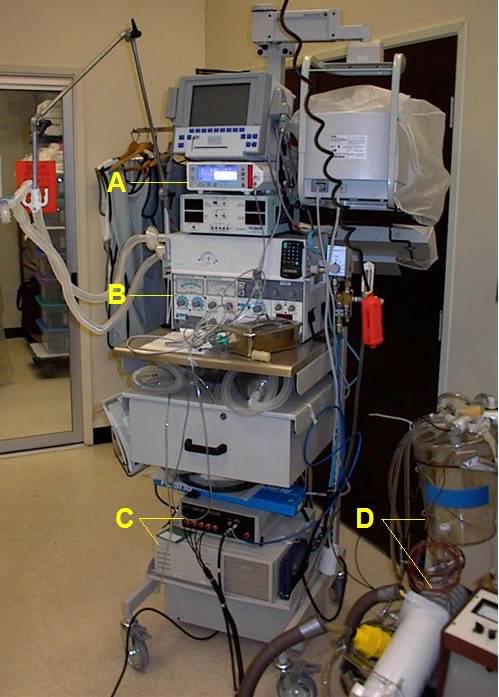
Figure 2-4: Gas ventilator and respiratory monitoring equipment used in the LAPC experiments; a) Novametrix CO2SMO respiratory function monitor and capnograph, b) Siemens Servo 900 C ventilator, c) Korr Medical, Inc., automated device used to perform rapid-cycle LAPC, d) LAPC apparatus.
Concurrent FC-75 FTLV and gas ventilation (LAPC) was performed for 18 min in Trials I and II (n=12). This time was chosen, on the basis of preliminary work (data not shown), to achieve rapid systemic-cooling of greater than 5°C. For Trials I and II, the PFC recirculation rate within the LAPC device (=PFC infusion rate, ˙V inf), was set at 50 ml/kg per min rate, VFTLV) was set at 50 ml/kg per min.
Immediately after a timed FTLV, PFC was removed as rapidly as possible. Infusion of PFC for the next FTLV began immediately after suction was discontinued. In LAPC experiments, PFC was chilled to ~4°C prior to FTLV (Table 1), whereas in normothermic (control) dogs, isothermic PFC was delivered to the dog within ~2°C of tympanic temperature (Ttym). The PFC inflow and outflow temperature was measured continuously by a thermocouple inserted into the PFC path at the base of the delivery/removal cannula. Temperature data was collected throughout LAPC, and for 22 min after LAPC was completed. Arterial blood gas (ABG) samples were taken from the femoral arterial line before the start of LAPC, and every 2 min during LAPC. Following the post-LAPC equilibration period, monitoring devices were removed and incisions closed.
Table 1:
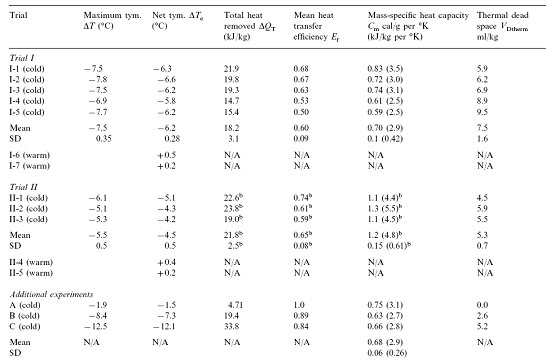
Table 2:
2.3. Trial I (manually-controlled LAPC)
Trial I was designed to investigate the variability in the response of individual animals to LAPC and to investigate the physiological effects of the LAPC technique with and without cooling (i.e., ~4ºC PFC vs. isothermic PFC FTLV). Either isothermic (near-body temperature) or ~4ºC PFC FTLV was administered using a manually-controlled system (V1–V5 in Fig. 1 represent CPB tubing-occluders in this Trial). One FTLV (period tc ~37 s) was composed of a timed FTLV (tinf = 20 s), followed by PFC suction (ts ~17 s). Suction was stopped when PFC liquid return became sparse, or gas pressure in the ventilator circuit fell below −5 cm H2O (−0.5 kPa). Five dogs received ~4ºC FTLV (Trial I-1–5), while two controls received the same protocol using isothermic FTLV (Trial I-6 and 7).
2.4. Trial II (machine-controlled LAPC)
Trial II assessed the utility of using an automated device (custom manufactured by Korr Medical, Inc., Salt Lake City, UT) to perform rapid-cycle LAPC. Computer-controlled solenoid clamp-valve occlusion of circuit lines at V1–V3 allowed smaller FTLV volumes (VFTLV) and smaller tc. While tinf was decreased to 10 s in Trial II, VFTLV remained constant, and the effective PFC FTLV rate (VFTLV) remained in the range of VFTLVfor Trial I. Table 1 gives relevant trial parameters. In Trial II, suction of PFC from the lungs began immediately after infusion, and was automatically stopped whenever a ventilator circuit pressure of −5 cm H2O was reached (ts ~6 s, giving tc ~16 s). Three dogs received ~4ºC PFC (Trial II-1–3), while two controls (Trial II-4 and 5) received isothermic PFC.
2.5. Animals A, B and C
Selected data from three dogs in an earlier method development series was used. These dogs had been prepared as above, then manually given 1, 15 and 21 FTLVs, respectively with ~4ºC PFC, at much slower rates than in Trials I and II (Table 1). Data from these animals allowed independent measurements of FTLV volume heat-contents and temperatures, and thus the heat capacities and heat transfer efficiencies, by a more thorough thermal accounting method (Table 2, Appendix A).
2.6. Data collection and correction, statistical methods, graphical display and presentation
Temperature and pressure data were collected using a PCI E series data acquisition board and LabVIEW™ software (National Instruments, Austin, TX). Graphical analysis and display of temperature data, and curve fitting, was done using the software package Origin™ (Microcal Software, Northhampton, MA). Statistical comparison of Trial group values was done using GraphPad Prism (GraphPad Software, San Diego, CA). Group means are reported ± standard
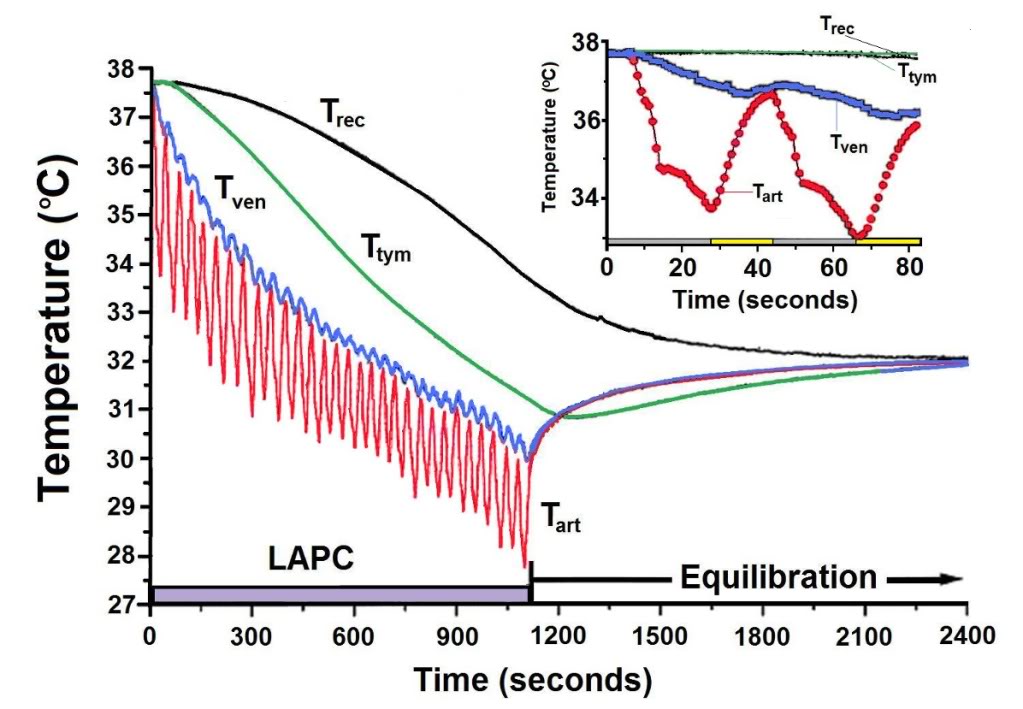
Figure 2-5 (above): Body temperature changes observed during LAPC (Method of Trial I). In this illustrative experiment from Trial I (I-4), FTLVs of ~4ºC FC-75 were infused (~20 s) and removed (~17 s) from the lungs. LAPC was performed for 18 min (hatched bar), then stopped to allow thermal equilibration (22 min). Arterial temperature (Tart), central venous temperature (Tven), tympanic temperature (Ttym), and rectal temperature (Trec) are shown. Inset: Enlarged view of temperature changes recorded during the first two cycles of PFC infusion (gray bar) and removal (yellow bar).
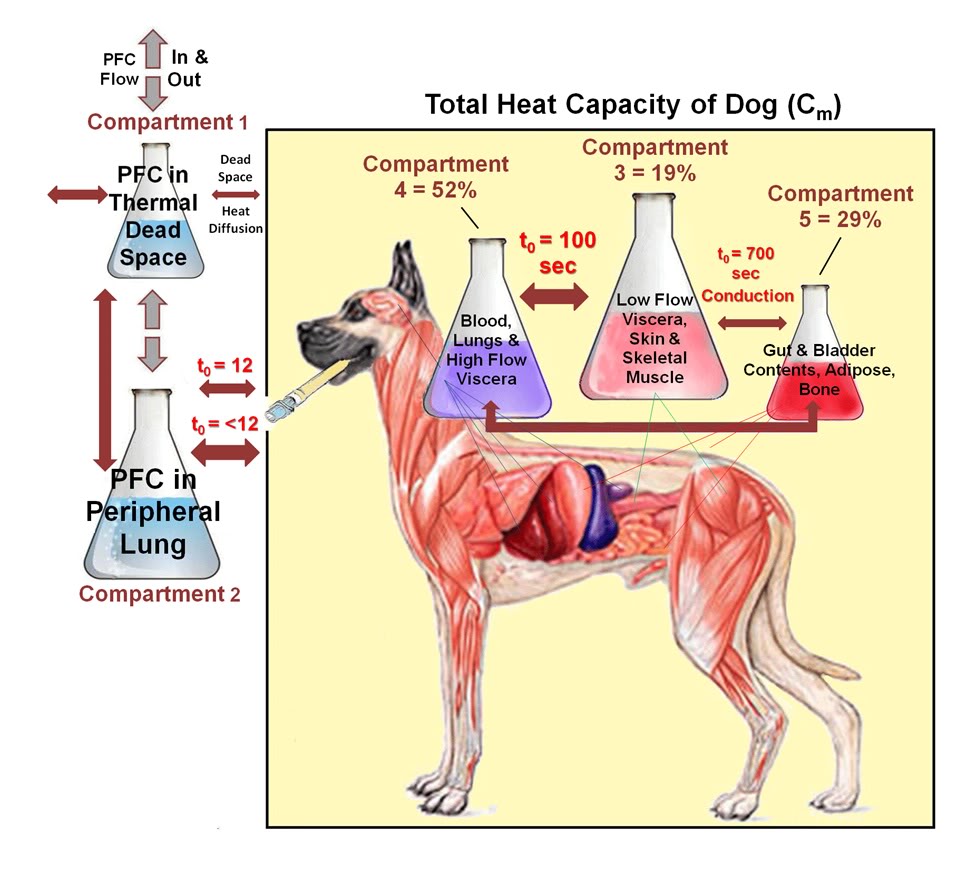
deviation (SD) except as otherwise noted. For each animal, the Ttym from whichever probe cooled most rapidly, was used (right probe in 12/15 dogs). In order to facilitate comparison of cooling rates between sites in the same animal, temperatures at all probe sites were corrected to the baseline aortic temperature (Tart), as measured immediately prior to the start of LAPC. For ease of description, LAPC-cooling is presented in terms of thermal-deficit (‘cold’) moving from the lungs into successive body compartments. A compartmental analysis of thermal transfer in this model, and a glossary of notation and equations used, is given in Appendix A.
3. Results
LAPC allowed FTLV of dogs during concurrent gas ventilation. Suction from the submerged catheter tip at the carina allowed collection of PFC even during forced gas inspiration. It was discovered that a long suction catheter was necessary to insure that adequate suction pressure could be used to withdraw PFC throughout the liquid removal sequence, without prolonged exposure of the gas filled portion of the airways to the negative pressure of the suction system/reservoir. Additional protection of the airways against excessive negative pressure during the relatively brief time after liquid no longer filled the suction line was provided by incorporating a negative pressure relief valve on the suction reservoir. Suction in this manner was efficient, although FTLV volume measurements showed that the lungs retained ~12 ml/kg PFC (approximately FRC) between FTLVs.
The PFC pump circulation/infusion rate (˙V inf), measured volumetrically preceding and following LAPC, was stable to within 1% over the duration of LAPC, and was not significantly different between trials (P = 0.28). The VFTLV, calculated as tinf inf/tc, was 30.7±2.3 ml/kg per min (Trial I) and 36.4 ± 3.2 ml/kg per min (Trial II). The ˙VFTLV was significantly (P = 0.023) larger in Trial II because machine-controlled suction made more efficient use of available non-infusion time, resulting in faster net PFC removal.
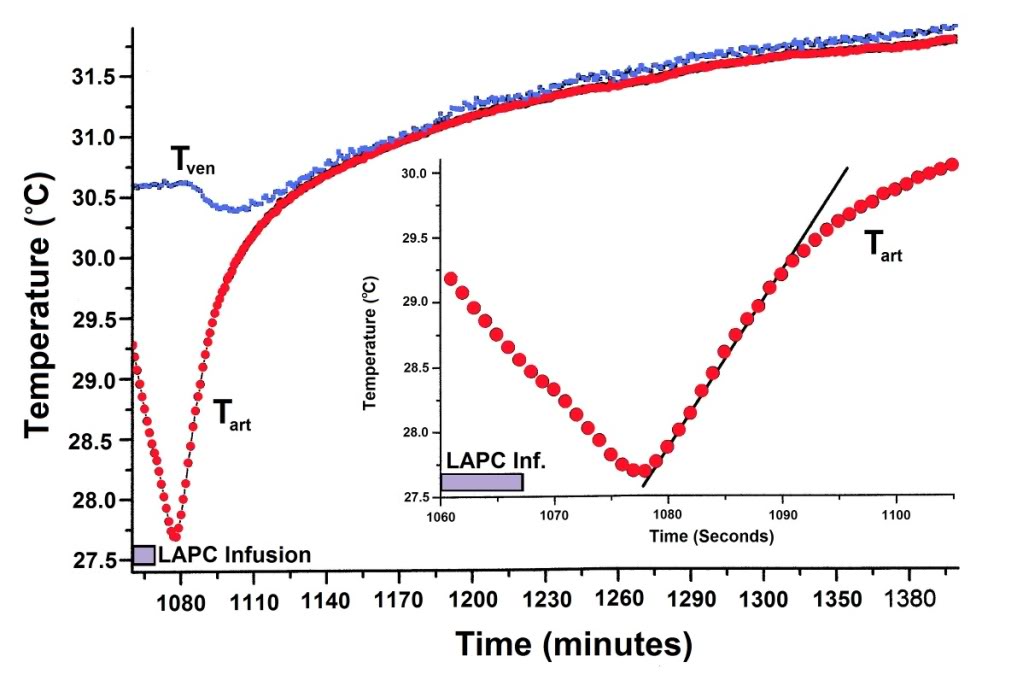
Figure 2-6: Thermal equilibration after LAPC. Mean Tart and Tven values (Fig. 2) are shown for Trial I, dogs 1–5. To highlight equilibration changes, Ttart curve nadirs (n=5) were superimposed before calculation of means, and Tven data (n = 4) for each dog was adjusted with its corresponding Tart curve. Incompatible Tven data from a pulmonary artery thermodilution catheter in I-2 has been omitted. Inset: The sigmoidal mean (N = 5) Tart recovery during the first ~12 s after final LAPC. FTLV is approximated by linear fitting.
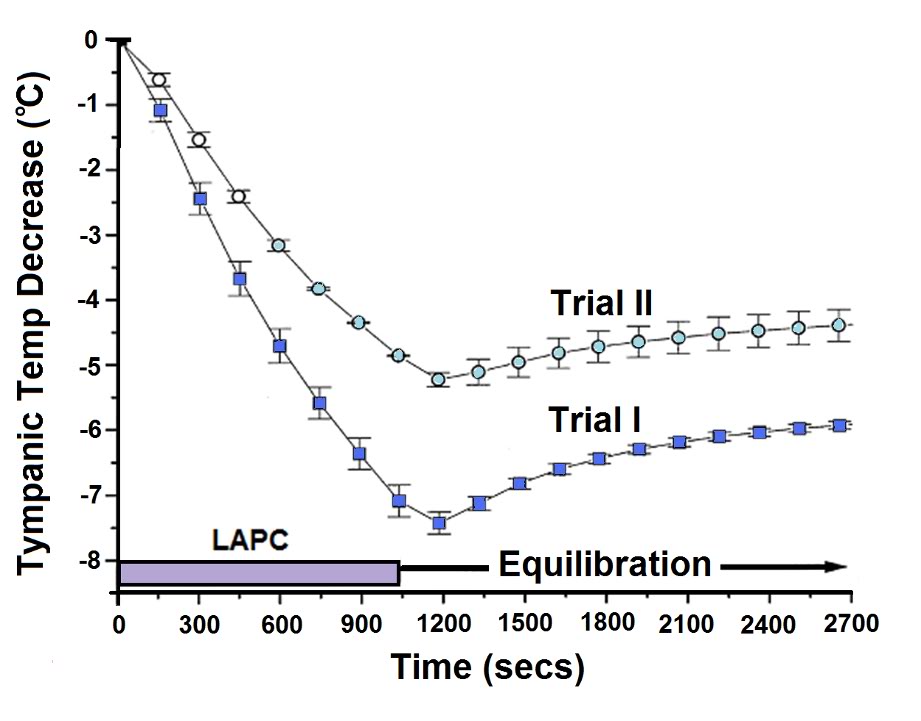
Figure 2-7: Body temperature changes during manual and mechanical LAPC (Trial I vs. Trial II). The relative rates of core body cooling in dogs undergoing 18 min (hatched region) of manual (Trial I, solid squares) or machine-driven (Trial II, open circles) ~4ºC LAPC, were assessed by comparing changes in group mean Ttym. Symbols represent the mean and SEM (n = 5 for manual, and 3 for machine groups).
3.1. Thermal results of LAPC
3.1.1. Cooling time delay
Figure 2-5 illustrates LAPC cooling in a representative dog (I-4) from Trial I. The Tart began to decrease 3–6 s after the start of each PFC FTLV. Since this delay included circulation delay from lungs to aorta, the transfer of thermal-deficit from newly-introduced PFC to pulmonary blood was very rapid. The venous temperature (Tven) began to decrease 10.4 ± 6.9 s after Tart decline, representing the minimum systemic circulation time. Though exhibiting delay, damping, and broadening behavior (presumably due to peripheral heat-exchange and varying systemic blood-return path lengths), Tven transients from FTLVs mirrored Tart transients. Ttym temperatures, presumably reflecting brain and viscera temperatures, were non-oscillatory. The Ttym did not begin to decrease until ~24 s after the start of LAPC. This decrease occurred in three phases: an initial phase lasting ~100 s, an exponential phase lasting for ~900 s, and a final linearly-decreasing phase lasting until the end of LAPC. Core cooling as measured by Ttym continued for about 120 s after the end of LAPC (Figure 2-5), then exhibited a marked rebound effect [185] with exponential dampening (t ~20 min, Figures 2-5–2-7). These phases of cooling and equilibration were consistent with a five-compartment thermal model, in which the three compartments representing animal tissues corresponded roughly with (1) the blood and vasculature; (2) the classical thermal core; and (3) the classical thermal periphery (Figure 2-8). Modelling equations and estimation of compartment sizes are given in the Appendix A.
3.1.2. Cooling rate
Crude cooling rates were determined numerically from appropriate T vs. t graph segments. The mean cooling rate from LAPC initiation, or DTtym/Dt, reached a maximum value in Trial I at −0.49±0.09°C/min (t=6.6 min). The differential cooling rate d (DTtym)/ dt = dTtym/dt reached a maximum (max) value of -0.59 ± 13°C/min at t ~100 s, near the end of the initial heat exchange development region. (This value is comparable to analytic d (DTtym)/dt (max) from (Eq. (1)) = DTk/to = −0.63°C/min). Corresponding cooling rates in Trial II were DTtym / Dt (max) = −0.33 ± 0.02°C/min (at t = 7.3 min) and dTtym / dt (max) = −0.37 ± 0.06°C/min (at t = 100 s).
3.1.3. Mean cooling power
The mean heat removal rate (cooling-power) P over the entire duration of LAPC, for each animal, was estimated from DTe according to P = m Cm DTe/t (total).
Here t (total) is the entire LAPC application time = ~1080 s. (Note: for this calculation, the more accurate Trial I mean Cm is used for all Trial II animals.) The mean cooling power of Trial I was 336 ± 60 watts, while that of Trial II (using the Trial I value of Cm) was 207 ± 49 watts (P = 0.02). Variation in animal size was the major source of intra-group variability.

Figure 2-8: Heat transfer among body compartments during LAPC. Heat transfer during LAPC in the dog may be modeled using 5 thermal compartments. Heat transfer between compartments (which is by blood circulation, except as noted) is shown in the box diagram as double-headed arrows. The pair of arrows connecting Compartments 2 and 3 represents the different processes of lung equilibration with (1) pulmonary artery flow; and (2) with the complete blood volume and selected viscera.
3.2. Gas exchange
ABG measurements demonstrated that infusion of ~4ºC PFC stabilized PaO2 and PaCO2 during LAPC. In contrast, LAPC using isothermic PFC failed to maintain baseline PaO2 or PaCO2 levels (Figure 2-9). In Trial II-4, hypercarbia during the first 13 min of isothermic LAPC was abolished by increasing the tidal volume from 15 to 25 ml/kg (final Vg = 375 ml/kg per min). In Trial II-5, Vg was pre-set to 375 ml/kg per min in an attempt to avoid hypercarbia, and no significant ABG changes were observed.
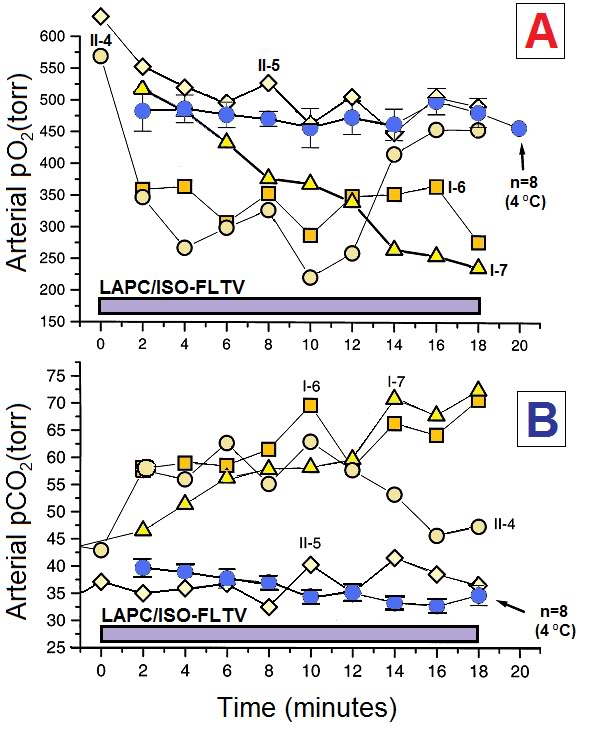
Figure 2-9: LAPC does not maintain normocarbia at isothermic temperatures without alteration of the gas ventilation parameters. Animals in Trials I and II underwent LAPC using either ~4ºC () or isothermic (r£ ¯) FC-75. Both arterial PaO2 (Panel A) and PaCO2 (Panel B) levels were affected by FTLV temperature. ~4ºC FTLV data from Trials I and II were very similar in magnitude, and therefore, have been combined (n=8). Isothermic LAPC is shown as four separate experiments (Trial I-6 and 7, and Trial II-4 and 5). Gas tidal volume was increased from 15 to 25 ml/kg in Trial II-4 at t=13 min, and at t=0 in Trial II-5, normalizing PaO2 and PaCO2 in both animals. Declining PaO2 in Trial I-7 was due to inadvertent failure to pre-oxygenate PFC.
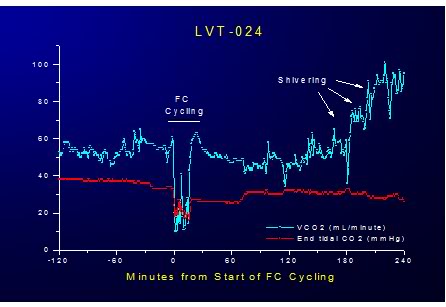
Figure 2-10: Effect of LAPC on VCO2 and EtCO2 during 20 minutes of ~4ºC FTLV. LAPC allows superior CO2 removal due to gas ventilation because ·V PFC = no more than 30 mL/kg/min of liquid, allowing gas ventilation of at least 200 mL/kg/min, resulting in a maximum ·VCO2 removal rate of >8 mL/kg/min or a minimum of 400% of basal metabolic rate.
3.3. Clinical observations and gross pathology
With the exception of one dog, animals subjected to LAPC displayed mild tachypnea and increased expiratory sounds, but otherwise exhibited unremarkable recovery from anesthesia, including the ability to walk and drink. The exception was an eosinophilic animal (Trial II-1) which had normal oxygenation during LAPC, but developed severe hypoxemia shortly after LAPC.
Chest X-ray pre- and post-procedure showed no (comparatively) remarkable features. This dog was sacrificed at 9 h.
Necropsy revealed a mass of D. immitis (heart- worm) embolized into the pulmonary arterial circulation, possibly as a result of local chilling of the parasite mass due to LAPC (this animal had been heartworm seronegative). Necropsies performed on nine remaining Trial I and II animals sacrificed 24 h post-procedure revealed diffuse spongy, resilient hyperinflated non-collapsible lungs (HNCL) seen in animals exposed to a high-vapor pressure PFC at high PIP pressures.[186] HNCL was most prominent in the anterior, least dependent areas of the lung lobes. This trapped intra-alveolar PFC was thought to be the cause of broncho-constriction and wheezing found in post-LAPC animals. There was also evidence gross, dependent-lung damage evidenced by pulmonary edema with consolidation in both isothermic and ~4oC PFC-FTLV animals.
Other organ systems in this series were grossly normal. Two animals in Trial II (II-3 and II-4) were not sacrificed, and were held for long term evaluation. They were neurologically normal at 1 year post-LAPC.
3.4 Impact on Hemodynamics
FTLV with both ~4ºC and isothermic PFC resulted in an almost immediate modest decrease central venous pressure (CVP) which persisted for the duration of the FTLV and recovered to pre-FTLV values at the conclusion of each FTLV cycle (Figure 2-11 – 2-13).
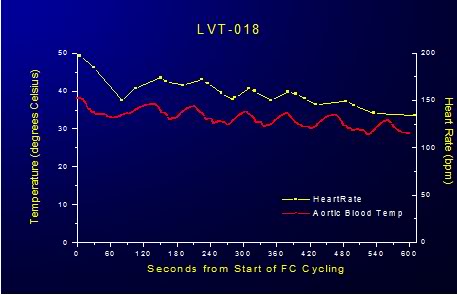
Figure 2-11: Impact of LAPC on HR.
In animals subjected to FTLV with ~4ºC PFC there was an immediate, transient reduction in heart rate (HR) and mean arterial blood pressure (MAP) and a corresponding increase CVP during the FTLV cycle. In animals undergoing ~4ºC FTLV these effects could be attributed to the acute, cyclical chilling of the coronary blood supply during each FTLV with chilled PFC. The temperature of the blood entering the coronary os was 10o to 15oC colder than systemic blood (as measured by pulmonary artery catheter), and this would be expected to have an immediate depressive effect on myocardial contractility due to the transient hypothermia the myocardium would experience as a consequence of perfusion with chilled blood. In fact, consonant with this interpretation, HR decreased steadily during ~4ºC FTLV, recovering progressively less after each FTLV cycle, as systemic hypothermia was induced (Figure 21).
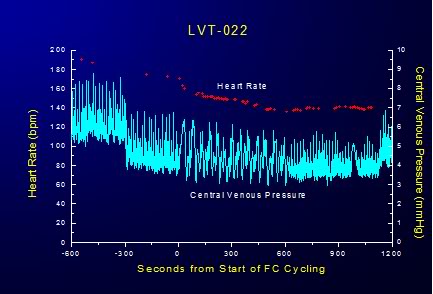
Figure 2-12: Cyclical variation in CVP is response to FTLVs with isothermal PFC.
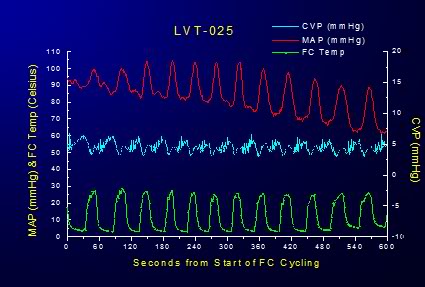
Figure 2-13: Effect of FTLV with ~4ºC PFC on MAP and CVP over the course of 6 minutes of LAPC. MAP is transiently markedly depressed and CVP is concurrently increased in response to loading with ~4ºC PFC; this effect is reversed when the PFC load is suctioned from the lungs; although there is increasing depression of MAP in response to the induction of systemic hypothermia. Cardiac output (CO) was not measured in these studies and mathematical analysis of the MAP waveforms generated during isothermic FTLV were not done. Thus, the precise extent to which FTLV with isothermic PFC (i.e., without the thermal-metabolic effects of chilled blood on the myocardium as occurs in LAPC) impairs cardiac output or coronary perfusion pressure is unknown.
Interestingly, the cyclical increase and recovery of the CVP remained constant during both ~4ºC and isothermic FTLV. Initially, the effect of FTLV on CVP was thought to be due to compression of the thoracic vena cavae by the relatively dense PFC load in the lungs. It was hypothesized that this effect might be more pronounced in the dog due to the V-shape of the canine thorax with the cavae resting at the bottom of the thoracic ‘trough’ in a dependent position under the lungs. To test this hypothesis, isothermic FTLV was carried out with a dog in the prone position. Pronation had no effect on the transient, cyclical depression of HR and increase in the CVP associated with FTLV. It thus seems possible that loading of the lungs with dense PFC liquid results in increased pressure on the thoracic vasculature, in particular on the thoracic venous vasculature, in much the same way gas PEEP reduces thoracic venous capacitance and raises CVP; reducing right ventricular preload and right ventricular output (cardiac output). These effects would seem the most likely explanation for the reduction in MAP observed during maximal PFC loading during both ~4ºC and isothermic FTLV.
CO was not measured during these LAPC studies nor was mathematical analysis of the aortic pressure waveforms undertaken to determine with precision the degree to which FTLV depressed MAP. Crude analysis of MAP during isothermic FTLV suggests that cyclical PFC loading is responsible for ~15-20% reduction in MAP over baseline. Mean CVP is increased ~35% over basal levels during FTLV. To what extent CO will be impacted as a result of FTLV with PFC during CPR will have to be determined experimentally (see discussion in 4.5.3. Overcoming Increased Intrathoracic Pressure and Preserving CO, below).
4. Discussion
4.1. Apparent effect of temperature on gas exchange
Isothermic LAPC in this model was surprisingly poor at removing CO2, considering that the CO2 carrying capacity in FC-75 decreases by only ~23% from 0 to 40°C (extrapolated from [184]). A useful observation was that pO2 values decreased even in isothermic animals, indicating an influence on total ventilation and possibly also reflecting decreased CO as evidenced by the (average) decline in MAP and increase in systemic vascular resistance during LAPC.
Capnographic analysis of LAPC in Trials I and II (data not shown) indicated that isothermic LAPC had a much larger negative effect on pressure-limited total gas ventilation Vg, as compared to ~4ºC LAPC using the same technique and the same gas ventilator settings. Since LAPC at a ˙VFTLVr of 30–36 ml/kg per min relies on gas ventilation Vg for ~50% of total alveolar ventilation, a differential loss of pressure-limited Vg with temperature appeared to be the basis of CO2 retention in isothermic LAPC. The mechanism of the implied differential change in lung compliance may be related to the depressive effects of FTLV on CO, and presumably, on perfusion. Thus, gas ventilation adjustments similar to those in Trial II-4 and 5 may be required if LAPC is used as a re-warming technique, and it may additionally be necessary to abolish gas PEEP, or even apply continuous negative airway pressure [187],[188] to counteract the PEEP-like effects of PCF loading and to generally improve CO and coronary perfusion pressure (CPP) during CPR.[189]
4.2. Thermal transfer efficiency and kinetics
The optimal LAPC cooling (or warming) protocol remains unknown. However, the finding that the thermal equilibration of non-dead space PFC and local pulmonary blood flow proceeds very rapidly (to <12 s) suggests that FTLV infusion times need to be no longer than this time scale. When PFC lung dwell times exceed this duration, the FTLV load is in place longer than is required to transfer the most labile part of its thermal potential to the pulmonary blood and parenchyma.
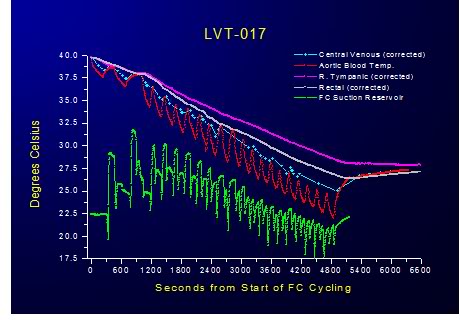
Figure 2-14: Relative insensitivity of PFC dwell time to heat exchange was demonstrated by progressively shortening the duration of FTLVs and increasing their frequency. Even at the maximum achievable rate of FTLV at ˙VFTLV rates of 30 ml/kg per min and ˙VFTLV rates of 50 ml/kg per min no deterioration in the efficiency of heat exchange was observed. This suggests that thermal equilibration at the level of the alveolus is practically instantaneous and that the shortest FTLV dwell time should be used for optimum heat exchange.
Since FTLV ventilation rates (˙VFTLVr) in the present study are already at least a third of the maximal rates possible in TLV, it seems probable that PFC infusion rates and pressures, rather than heat transfer rates from PFC to lung, will be the fundamentally limiting factor to power transfer in LAPC. These observations suggest that, as least to ˙VFTLV r rates of 30 ml/kg per min and ˙VFTLV rates of 50 ml/kg per min, the total cooling power (cooling rate) in LAPC will be greatest if no PFC dwell time is allowed, and all available time during the FTLV cycle is used to either introduce, or remove, PFC.
4.3. Question of diffusion dead space in LAPC
Mammalian lungs depend on simple gas diffusion for CO2 transport through the acinar airways during normal tidal ventilation. An intractable problem in experimental TLV has been that simple diffusion is not sufficient to similarly move CO2 through liquid PFC at physiologic CO2 partial pressure gradients. This limitation appears in TLV as a ‘CO2 diffusion dead space’ which effectively lowers alveolar ventilation. In part due to such extra physiologic dead space, TLV of adult humans has been estimated to require liquid minute-volumes near 70 ml/kg per min.[190] This value is at the upper bound of realistically attainable liquid flow rates [191],[192] and leaves little leeway for treating hypercarbia, hypermetabolic states, or lung disease. Such difficulties are not a theoretical limitation in LAPC, however, since LAPC does not require high liquid flow rates for ventilation. In the most rapid-cooling LAPC protocol used in this trial, ˙VFTLV was 31 ml/kg per min—a low baseline value which permitted the addition of 10 times this minute-volume of gas ventilation (see Fig. 4, Trial II-4, 5). Moreover, since normal gas minute volumes were required to maintain normocapnia in Trial I, there is as yet no evidence for any CO2 diffusion limitations caused by intrapulmonary PFC in LAPC. Possible reasons for this are discussed below.
Thermal-diffusion limits in TLV have not been studied per se, but their presence is suggested by the results of Shaffer and co-workers.[155] In their cat TLV model using a ˙V FTLV of 75 ml/kg per min, a decrease in PFC inspiration temperature from 20 to 10°C (increasing the thermal gradient by a factor of 1.6) increased the cooling rate from −0.13 to −0.15°C/min. This small rate change represented a significant loss of efficiency. By contrast, in the present LAPC study using PFC at 4°C, there was no evidence of a thermal-diffusion limit at rates up to 4 FTLVs/min. Notably, in Trial I, where 100% of the VFTLVr, and 40% of the ˙VFTLVr of the cat TLV model was used, cooling rates for LAPC were more than three times those reported for cats subjected to TLV at 4.5 liquid breaths/min at 10°C.[155]
The possible quantitative presence of a thermal diffusion limit for LAPC at 4 FTLVs/min may be evaluated using a modified version of the concept of gas-exchange dead space (VD). The respiratory system of a dog undergoing LAPC heat-exchange may be considered, by analogy with gas exchange dead space (VD), to also contain a ‘thermal exchange dead space’ (VDtherm). Each thermal FTLV volume ˙VFTLV of PFC then also contains a VDtherm , which by definition does not participate in heat-exchange. Thus, cycle thermal transfer efficiency Ef may be expressed as (VFTLVr − VDtherm) / ˙VFTLV, and any measured value of mean Ef may be expressed as an equivalent mean VDtherm = ˙VFTLVr (1− Ef). For Trial I (Ef = 0.6, Appendix A for calculation), mean VDtherm was then seen to be 7.5±1.6 ml/kg, and in Trial II (using Eq. (6) Ef Value = 0.40), VDtherm was 5.3±0.8 ml/kg (P = 0.072). The absence of an increase in VDtherm in Trial II vs. Trial I indicated that the size of VDtherm in these LAPC protocols was non-dynamic at time-scales of one FTLV cycle, providing evidence against the presence of a ‘thermal diffusion dead space’ (analogous to a CO2 diffusion dead space) at these FTLV rates. In absolute terms, it may be useful to compare calculated VDtherm in the LAPC dog model to the expected physiologic gas-exchange dead space, VDCA, which in healthy animals is close to the dog anatomic VD = ~6.5 ml/kg.[193]
In thermal diffusion, as in gas diffusion, diffusion physiologic dead space would be expected to significantly add to anatomical dead space. However, the sum of mechanical-VD in the LAPC circuit (~1.5 ml/kg) plus the anatomic VD for dogs is found to be more than the calculated VDtherm in either trial in this study, leaving little room for a large heat-diffusion contribution to VDtherm. For these reasons it is suggested that the loss of cooling power observed in Trial II was not due to heat diffusion limitations, but instead due to a loss of efficiency effect similar to that seen with low tidal volumes in ordinary gas ventilation. In these terms, low FTLV volumes in LAPC result in an increase in ‘thermal dead space ventilation’ at the expense of PFC flow involved in active heat-exchange, resulting in a larger ‘wasted’ FTLV VDtherm / ˙VFTLV. VD in heat transfer (VDtherm) that is analogous to VD in gas-transfer; in as much as all dead space is ‘diffusion dead space’ at long-enough time-scales. However, some of the mechanisms for diffusion modification of VDtherm are unique. By contrast with gas molecules, heat diffuses rapidly through device tubing into the PFC in the LAPC circuit dead space, and heat also diffuses directly through the tracheal wall into the anatomic-VD. Thus, heat diffusion from dead space liquid at sufficiently slow FTLV rates might be expected to have a pronounced effect on Ef in LAPC, due to slow heat-diffusion reduction in VDtherm.
Some evidence for such a process was found, though at FTLV dwell times too long to be of interest for rapid cooling. At the relatively small tc of Trials I and II, the calculated VDtherm was found to be ~VDCA; but in animal B, with a much longer tc of 7 min, the VDtherm was only 2.6 ml/kg. The limit of this process was reached in animal A, in which the VDtherm of a single retained ‘breath’ of highly-oxygenated PFC fell to nearly zero after 10 min. Disappearance of VDtherm by thermal equilibration, estimated from individual cycle Ef variations in animals B and C, was estimated to occur with a half-time of ~5 min (data not shown).
This process was slow enough to be neglected when the duration of FTLV intervals (tc) was less than several minutes.
Thus, at the FTLV rates of Trials I and II, a full-sized VDtherm of ~6 ml/kg appeared, and accounted for significant loss of cooling power at low ˙VFTLV (e.g. Trial II where VFTLV was only 8.8 ml/kg). The characteristic size of VDtherm at all but the slowest FTLV rates (~1 FTLV per 5 min) implies that the only thermally-efficient solution for performing LAPC at faster rates is maintenance of [˙VFTLVr / VDCA] or [˙VFTLVr / VDtherm] ratios >3, in order to avoid excessive ‘wasted’
VDtherm ventilation. This requires a ˙VFTLV of ~18 ml/kg in dogs. In humans, where the anatomic-VD is <3 ml/kg, less than half the value for dogs, both the VDtherm, and therefore, most-efficient ˙VFTLV values, might also be expected to be correspondingly less. In any case, it is clear that rapid-cooling LAPC techniques cannot wait for the relatively slow thermal equilibration of PFC within the anatomical VD, since equilibration in the remaining non-VD parts of the lung is so rapid (i.e. less than Trial II tc of 16 s).
4.3.2. Possible synergy of combined gas and liquid ventilation in assisting mass (CO2) and heat transfer
The absence of expected heat-diffusion and gas-diffusion limitations in LAPC suggests that some assistive process for both gas and heat transfer through PFC in the peripheral lung may occur in LAPC. The authors’ fluoroscopic observations (made with the non-brominated and relatively radiolucent FC-75) have been that each gas breath in PLV produces a flash of fine bubbles which spread uniformly throughout the lung. As compared to the more familiar behavior of water, the low surface tension of PFCs (15 dyne-cm for FC-75, about 1/5th that of water) lowers the energy barrier to producing small bubbles in forced gas/liquid flows. Such
bubbles moving within small airways may induce eddies and turbulence in laminar liquid flows at small scales, contributing significantly to heat and mass (CO2) transport though PFC liquid by means other than diffusion.
It is hypothesized that the lack of bubble-induced turbulence in TLV may account for the large diffusion-dead-space for heat and CO2 which seems to be present in TLV at even low breathing rates – an effect which is apparently absent in both PLV and LAPC.
4.4. Potential development of clinical LAPC
Rapid cooling of the CNS has now become a primary goal in the clinical management of the post resuscitation syndrome [49] and potentially in the acute management of spinal cord injury.[194],[195],[196] Based on their work, Safar, et al., have noted that clinical implementation of mild resuscitative hypothermia, which was highly effective in the dog model of SCA, will depend upon the development of truly rapid MTH.[197] A recent editorial in Stroke [83] commented on the striking ability of the combination of (33-35oC ) [198] and pharmacological pre-treatment to ameliorate ischemic brain damage in the rat middle cerebral artery occlusion model, and then addressed similar concerns: “A problem for use of this technique for acute stroke therapy is that the time required to induce hypothermia in patients is likely to be considerably longer than for rats. […]. To substantially increase the rate of hypothermia induction in humans, it will almost certainly be necessary to use some sort of invasive procedure, such as a heat-exchanger, to cool the circulation.”
The technique of LAPC may eliminate the need for such invasive measures. For example, in the cited trial [199], rats were cooled from 37 to 33°C (−4°C) over 40 min, using surface cooling with ice packs. By contrast, the present study demonstrates cooling of the canine body core and brain by −4°C in less than 10 min.
4.5. Challenges Ahead
4.5.1. PFC Selection
Development of clinical LAPC awaits identification of suitable PFCs for various LAPC applications. For example, the pharmaceutical PFC perfluorooctylbromide (Perflubron™ Alliance Pharmaceuticals) would presumably not be suitable for rapid LAPC cooling due to its freezing point of +6°C, but might be useful for slower cooling or for LAPHE facilitated re-warming. Some industrial PFCs have pour-points low enough to make them potentially useful as LAPC rapid-cooling media; however, most of these agents also have unacceptably high vapor pressures at 37°C or are not chemically defined in terms of chain length or even precise chemical composition (see Section 3: Perfluorchemicals). PFCs with such high vapor pressures exacerbate barotrauma by causing HNCL.
High vapor pressure PFCs may also increase the danger of long lasting lung collapse as a result of PFC, secondary to pneumothoraces, entering the pleural space and vaporizing (‘perfluorothorax’). FC-75, (formerly FX-80) was the first PFC used in liquid ventilation [10], but its relatively high vapor pressure (31.5 torr) makes it an undesirable LAPC agent. Assuming that a PFC with the desired biophysical properties is identified and produced to medical standards, LAPC should be easily scalable to adult humans. For example, the viscosity of FC-75 is similar to water [11], and under standard suction a 19 Fr. An adult pulmonary toilet catheter will remove FC-75 at ~2 l/min. As in the system described, a LAPC system may interface with a conventional gas ventilator system via a simple liquid-carrying catheter which extends through the endotracheal tube adapter suction port.
4.5.2. Coronary Perfusion during LAPC
The effect of LAPC on coronary perfusion in the setting of ROSC following cardiac arrest due to myocardial infarction (MI) or in the presence of coronary artery disease (CAD) is unknown but is a possible cause of concern. One possible adverse effect is the potential compromise of the coronary circulation in CAD due to perfusion of the heart with profoundly chilled blood (i.e., blood temperature @10°C below systemic temperature) leaving the pulmonary circulation and entering the coronary os. One of the authors (Darwin) has observed the onset of severe, acute angina in two hemodialysis patients with stable angina who were inadvertently dialyzed using very cold dialysate (QB of 250 ml/min at a blood temp of ~10° to 15°C) which resolved only when the dialysate temperature was increased to 30°C or above.
It is well established that exercise in cold environments, with associated inhalation of cold air, can trigger angina and lead to cardiac arrest in patients with coronary artery disease.[200],[201] There has been considerable debate as to whether the cause of angina in this setting is due to cold air inhalation per se, or to the effects of a cold environment. It has been suggested that exposure to a cold environment is the primary factor in inducing cold weather angina, presumably by increasing peripheral vascular resistance resulting in an increase in cardiac workload at any given level of exercise [202],[203] in the same way that the cold pressor test produces acutely increased afterload and thus increased left ventricular wall stress.[204],[205],[206],[207] Hattenhauer and Neill [208] studied 33 male patients with coronary artery disease,11 of whom gave a positive history of angina when exposed to cold winter air. Seventeen of these patients were subjected to inhalation of cold air at -20°C for 4 min, and this resulted in angina at rest in four of these patients.
Cold air inhalation also produced angina in four of the seven patients who were paced at a heart rate which was well below the threshold for angina at room temperature. Cold air inhalation did not significantly increase myocardial oxygen consumption, or alter coronary blood flow as determined by the xenon clearance method. In a separate arm of the Hattenhauer and Neill study, cold air inhalation for 90 s in 18 patients produced no detectable-constriction of coronary arteries visualized angiographically. The investigators concluded from these findings that cold air inhalation induced angina could not be explained by an increase in cardiac work and myocardial oxygen consumption.
This study also demonstrated that there was no evidence of large or intermediate coronary artery or coronary arteriole constriction in response to the inhalation of very cold air. As a consequence, the authors proposed that cold air inhalation induced angina might be the result of constriction of minute coronary collaterals, or to other vessels compromising blood flow to potentially ischemic regions of the diseased myocardium. The work of Lassvik and Aveskog [209], confirmed the effects of cold air inhalation in inducing angina and failed to demonstrate any decrease in workload at either the onset of angina or at maximal workload during inhalation of moderately cold air (-10°C) in a room at 20°C. Dodds, et al., [210] evaluated 12 male patients with stable angina inhaling cold air (-8.8°C) during exercise to investigate if the vasoconstrictor peptides endothelin-l (ET-1) and angiotensin-II (AT-lI) played a material role in the etiology of this phenomenon. They concluded that neither ET-1 nor ATII had any significant role in the pathophysiology of cold air inhalation induced angina.
In contrast to Hattenhauer and Neill, and Lassvik and Aveskog, these investigators documented decreased myocardial oxygen consumption during peak exercise in cold air inhalation and concluded that the cause of this was a centrally operating mechanism such as a reduction in coronary flow. These investigators noted that the response to cold air inhalation was biphasic, and posit that the initial response; earlier onset of angina during exercise while breathing cold air, was due to activation of cold receptors in the upper airways stimulating a systemic increase in peripheral vascular resistance; and thus the observed accompanying rise in blood pressure and increased cardiac workload (i.e., the cold pressor test response). The secondary response; reduction in total exercise time, which occurred at a significantly lower rate-pressure product compared with the same patients breathing ambient temperature air, was thought to be due to peripheral reflex responses. Thus, these investigators hypothesize that the early onset of angina during exercise is due to sympathetic stimulation from inhaled cold air, but as exercise continues, central mechanisms play an increasing role in the pathophysiology of cold air inhalation induced angina.
The implications of cold air induced angina for LAPC in the setting of coronary artery disease are troubling and certainly bear careful investigation in animal models of compromised myocardial circulation. Patients in all of these studies developed significant ST depression (³ 1 mm) concurrent with the onset of cold air inhalation induced angina, suggesting clinically significant myocardial ischemia. What is unclear is whether the concomitant profound reduction in myocardial temperature seen in LAPC (both transient and long-term) will be protective against any perturbation in myocardial perfusion induced as a result of the sympathetic or central effects of cold FTLV.
Such a protective effect is suggested by the well established finding that ‘cold’ (~34°C) hemodialysis (HD) is protective against both intra-dialytic hypotension and angina [211], [212],[213],[214], as a result of sympathetic stimulation from the return of ‘cool’ blood to the systemic circulation. [215],[216],[217] In addition to its protective effect on hemodynamics during aggressive ultrafiltration, cold HD also attenuates the hypoxemia leucopoenia, [218] and the production of Complement 5a induced by blood exposure to the dialyzer membrane.[218],[219] It should also be noted that catecholamine administration (mimicking profound sympathetic stimulation) in the form of epinephrine is still a mainstay treatment of ventricular fibrillation and aystole in SCA.[59, 220],[221]
Finally, it is essential to point out that mild and even moderate induced hypothermia not only do not interfere with defibrillation from cardiac arrest, but actually greatly facilitate conversion of VF to perfusing NSR.[222],[223],[224],[225],[226]
4.5.3. Potential for Regional (Myocardial) Overcooling
Under the low flow conditions of CPR, the possibility exists that due to thermal compartmentalization myocardial temperature could be reduced to below the fibrillation threshold or to adversely affect contractility. In the laboratory and the clinical setting moderate (28-32 oC ) and deep (10-22 oC) hypothermia are known to induce both benign and malignant cardiac arrhythmias; [227],[228] and ventricular fibrillation is the most common cause of death in accidental hypothermia. [229],[230] In addition to the arrythymogenic effect of deep hypothermia (J waves, prolonged PR, QRS, QT intervals, and atrial arrhythmias) there is evidence that defibrillation becomes increasingly problematic as myocardial temperature decreases below 30oC.[231],[232],[233]
The temperature of blood leaving the pulmonary circulation under normal flow conditions (during spontaneous circulation) within 5 minutes of the start of LAPC can reach temperatures of 17-20oC (see Figure 2-14, FC Suction Reservoir Temperature; this temperature closely approximates the PA blood temperature during the FTLV cycle). This is benign under high flow conditions because heat is being rapidly and continuously transferred between body compartments (Figures 2-5 – 2-7). However, under low flow conditions, and especially in the presence of pharmacologically induced severe peripheral vasoconstriction, rapid, selective core over-cooling could occur.
Disproportionate cooling of the body core happens under normal conditions in humans given large volumes of intravenous fluid chilled to 4oC, and this is the basis for cold IV fluid induced hypothermia for cardiac arrest.[234],[235],[236],[237] This surprisingly durable core cooling, well beyond that predicted on the basis of calculations for the whole body, occurs because the thermal distribution volume in humans given rapid cold IV infusions turns out to be much lower than total body volume. The result is that chilled IV fluids are ~3 times more effective in inducing hypothermia than suggested by all-compartment equilibrium calculations.[234] Several explanations have been offered for this apparent thermodynamic inconsistency; most plausibly that peripheral vasoconstriction and inherently slower kinetics of heat exchange between central and peripheral compartments act to keep core temperature below the all-compartment equilibrium for at least 60 min after the conclusion of the cold IV infusion [238],[239] which is long enough for external cooling to begin contributing to cooling and for endovascular cooling to be initiated under ideal conditions.
These findings provide additional reason for vigilance in avoiding excessive myocardial or core cooling during CPR and suggest that a surrogate for myocardial temperature be sought and that the use of warmer PFC FTLVs be explored; trading off rapidity of temperature systemic reduction against the danger of over-cooling the heart.
4.5.4. Overcoming Increased Intrathoracic Pressure and Preserving CO
Following the development of active compression decompression CPR (ACD-CPR) by Cohen, et al., in 1992 [240] the critical importance of maintaining negative intrathoracic pressure during the decompression phase of the CPR duty cycle has become increasingly understood.[241],[242] There is a rapidly growing body of both animal and clinical CPR research documenting improved survival and decreased neurological morbidity when the intrathoracic pressure is kept negative during the decompression (release of chest compression) phase of CPR by the use of inspiratory impedance threshold devices and active ACD-CPR.[188],[243],[244],[241] Similarly, there is accumulating evidence that the increased intrathoracic pressure that results from excessive positive pressure ventilation (PPV) during CPR dramatically reduces CO and causes increased morbidity and mortality.[245],[246],[247],[248],[249],[250]
In 2004, Yannopoulos, et al., reported the development of a device which allows for the continuous application of negative intrathoracic pressure (Figure 2-15) by applying controlled suction to the airway.[187] This device, called the intrathoracic pressure regulator (ITPR) allows PPV to be delivered as needed during ACD-CPR, while maintaining negative intrathoracic pressure at all times when PPV is not being administered. The device effectively transforms the thoracic cavity into a low negative pressure (vacuum) chamber; increasing venous return from the body and consequently increasing preload and cardiac output. The ITPR also markedly increases CPP while at the same time decreasing intracranial pressure (ICP). In CPR ICP is typically elevated from the basal value of 12-16 mm Hg to 22-30 mm Hg (as the result of pressure transmission by blood in non-valved veins and by transmission of intrathoracic pressure via the cerebrospinal fluid) further compromising already inadequate cerebral perfusion.[251] Reduction of ICP during CPR has been shown to improve both survival and neurological outcome in an animal model of CPR.[252]
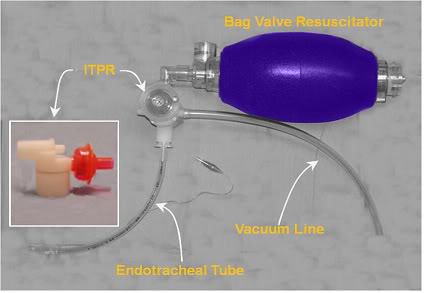
Figure 2-15: Prototype ITPR (Advanced Circulatory Systems, Inc.) in position in a typical bag-vale resuscitator – ET tube set-up.
The ITPR has been shown to dramatically improve gas exchange, hemodynamics, blood flow, vital organ perfusion, and short-term survival rates during VF cardiac arrest in a porcine model of SCA and CPR [187] The ITPR is able to not only overcome the high intrathoracic pressures. associated with CPR (45 to 55 mmHg or ~61 to 75 cmH20 [253]) but to both create and sustain negative intrathoracic pressure (determined indirectly by measuring the ET tube pressure) continuously during prolonged periods of ITPR-CPR, even in the presence of induced hypovolemia.[189] In hemorrhaged (hypovolemic) pigs, Yannopoulos, et al., were able to sustain CPP at >15 mm Hg (the accepted threshold for successful defibrillation in human SCA) and the isovolemic VF animals in the study maintained CPP at >25 mm Hg throughout the full 15 minutes of ITPR-CPR. In both groups, ETCO2 was consistently maintained >25 mm Hg, and the 1-hour survival was 100%, as contrasted with 10% in control animals receiving AHA standard CPR (P = 0.0001).
By comparison, after 3 minutes of conventional CPR the control animals had a mean coronary perfusion pressure of <15 mm Hg and all had developed pseudo-respiratory alkalosis indicative of the V/Q mismatch of standard CPR.[254] Blood gases in VF animals were strikingly preserved during ITPR-CPR; paO2, which was 96±2 mm Hg at baseline, was 214±12.37 mm Hg after 10 min and 198±6.75 mm Hg after 15 min of ITPR-CPR. These findings would seem to suggest that ITPR-CPR may be reducing or eliminating the pulmonary edema that accompanies CPR and the high intrathoracic (and thus pulmonary arterial and venous pressures) generated during CPR. ITPR is similarly effective at improving both hemodynamics and survival in a swine model of severe hypovolemic hypotension.[255]
The use of an ITPR during LAPC offers the prospect of reducing or abolishing the undesirable hemodynamic effects of FTLV with PFC. These effects, while not clinically significant in the healthy animal with spontaneous circulation undergoing LAPC (and the ability to dynamically respond to alterations in preload, CVP and SVR), may be unacceptable in the setting of cardiac arrest and CPR.
While it is clear that FTLV with PFC reduces MAP and elevates the mean CVP,[2] the extent to which these effects will reduce CO during CPR is unknown and will necessarily require further experimentation in animal models of SCA and CPR that closely approximates those experienced in humans under clinical conditions. The mechanics of CO and perfusion in CPR are radically different than those that pertain under conditions of spontaneous circulation.[256],[257],[258] In the healthy beating heart, modest increases in CVP (~5-15 mm Hg) result in increased cardiac output via the Frank-Starling mechanism (Starling’s Law of the Heart). Increased CVP increases left ventricular diastolic end pressure (LVEDP) increasing ventricular volume and stretching the ventricular myofibrils. Myofibrillary stretch results in sarcomere extension thereby increasing the affinity of troponin C for calcium, causing a greater number of cross-bridges to form within the myofibrils; this increases the contractile force of the heart increasing CO. This biochemical mechanism is not operational during cardiac arrest and CPR. Indeed, as outlined in the discussion below, little of the mechanics of perfusion under normal physiological conditions pertain in the setting of CPR.
4.5.5. Consideration of the Mechanics of Blood Flow in CPR and Implications for LAPC
During CPR in humans ventricular volume is not a primary determinant of CO, at least not in an appreciable fraction of patients undergoing CPR.[258] Despite the fact that it has been forty-eight years since the invention of closed chest CPR – the mechanics of blood flow during CPR in humans have not been definitively established – and a great deal of controversy surrounds the subject. Broadly, three mechanisms of antegrade blood flow have been proposed in (human) CPR:
- The Direct Cardiac Compression (Cardiac Pump) Theory posits that mechanical compression of the ventricles between the sternum and vertebral column creates a pressure gradient between the ventricle and the aorta (or pulmonary artery in the case of the right ventricle); as a consequence the mitral and tricuspid valves are closed, and blood is moved antegrade out of the ventricle. The ventricle then refills during the decompression phase of CPR and the process is repeated with each compression cycle.[259] The cardiac pump theory was most definitively challenged with the publication of case data documenting the ineffectiveness of CPR in patients with flail chest. This could be reversed only be restoring elastic recoil to the chest by binding it; indicating that it was the generation of a net negative intrathoracic pressure upon recoil of the chest during the decompression phase of CPR that was essential for blood flow.[260]
- The Thoracic Pump Theory asserts that chest compression increases intrathoracic pressure forcing blood to flow from the thoracic to the extrathoracic circulation[3]. Retrograde flow from the right heart to the systemic veins is prevented by the venous valves; with the heart serving only as a passive conduit, and having no function as a pump.[261], [262] In the thoracic pump paradigm blood circulates because increased intrathoracic pressure is transmitted more or less equally to all of the intrathoracic vascular structures [256] and the atrioventricular valves remain open during the compression phase of CPR.[263] However, these intravascular pressures are not equally transmitted to the extrathoracic arterial and venous beds, thus creating an extrathoracic arterial-venous pressure gradient resulting in antegrade blood flow during the period of high thoracic pressure. During the decompression phase of CPR, blood flows into the lungs as a result of the extrathoracic venous-to-intrapulmonary pressure gradient. Angiographic [256] and echocardiographic studies in dogs documented static ventricular volumes during CPR [262], and case reports of human patients with cardiac tamponade recovering successfully after closed chest CPR both supported the thoracic pump mechanism as the explanation for antegrade flow in CPR.[264]
- In the Lung Pump Theory, as in the thoracic pump theory, the increased intrathoracic pressure during the compression phase of CPR is similarly transmitted equally to all intrathoracic vascular structures and there is insignificant regurgitation of blood from the pulmonary artery into the right ventricle and vena cavae until the pulmonary valve closes. [265] Thus, blood under pressure within the pulmonary vasculature will flow out of the lungs via the left side of the heart.[263],[266] During the decompression phase of the cycle the intrathoracic pressure drops below that present in the extrathoracic vasculature and blood flows into the thorax via the vena cavae and aorta. The pulmonary vascular volume is replenished by blood flowing from the right side of the heart through the open tricuspid and pulmonary valves. [266], [267] Retrograde aortic flow is prevented by competent closure of the aortic valve.[268],[265]
Transthoracic echocardiographic studies reported in the early 1980s during CPR in humans supported the thoracic pump theory.[268],[265] However,more recent studies employing transesophageal echocardiography (TEE) have concluded that because the mitral valve was observed to close during the compression phase, and open during the decompression phase, and the left and right ventricular volumes decreased during the compression phase, the mechanism of antegrade flow during CPR was consistent with the direct cardiac compression theory.[269],[263]
Perhaps the most likely explanation of these seemingly incompatible findings is that all three mechanisms are responsible for antegrade flow, but not in every patient. In other words, the mechanics of forward flow may differ from patient to patient. In fact, in the 1981 paper in which they proposed the thoracic pump theory of antegrade blood flow in CPR, Weisfeldt and Chandra stated, “It is not essential in the human to think about these mechanisms in an exclusive fashion. Direct cardiac compression is useful when possible; when it is not potent enough to maintain cerebral perfusion, manipulation of intrathoracic pressures would likely have a favorable additive effect on carotid blood flow.”[261]
In support of this view is the study by Ma, et al., which evaluated 17 patients undergoing CPR using TEE to measure both pulmonary and trans-mitral flow.[270] Five of the 17 patients demonstrated closure of the mitral valve during the compression phase of CPR, with associated mitral regurgitation and forward aortic flow occurring which is consistent with the cardiac pump theory.
In the remaining 12 patients, the mitral valve remained open during both the compression and decompression phases of CPR with maximal antegrade mitral flow occurring during the compression phase of CPR. Eight of these 12 patients demonstrated antegrade mitral flow during the compression phase that was accompanied by antegrade pulmonary vein flow; consistent with the classic ‘thoracic pump’ mechanism. The last 4 patients in this study evidenced retrograde pulmonary vein flow concurrent with antegrade mitral flow during the compression phase; which is most consistent with lung pump theory as the primary cause of antegrade flow, at least in these patients.
5.0 Review of the Literature on LAPC
From the foregoing, it should be easy to understand the difficulty of establishing by experiment, let alone extrapolating on any theoretical basis, what the hemodynamic impact of FTLV or LAPC will be under clinical conditions in humans undergoing CPR. Similarly, the effect of LAPC on regional myocardial blood flow, myocardial irritability, coronary electrophysiology, and susceptibility to defibrillation will require further laboratory and, likely, experimental clinical investigation as well. Since publication of the 21CM/CCR LAPC research in 2001 there have been 4 subsequent studies to evaluate various aspects of the utility and safety of LAPC for application in CPR, or as a therapy in MI.
The first of these studies was published by Hong, et al., in 2002 and announced, “Our study is the first to demonstrate an induction of hypothermia by adopting PLV (no need of an extracorporeal circuit) and 0°C PFC.” [271] failing to cite the previously published work of either Darwin, et al., or Harris, et al. [272] These investigators attempted to validate the utility of LAPC using FTLV to achieve rapid reduction in core temperature and also studied the physiological impact of the procedure. The cooling rate achieved appears to have been ~0.11°C/min and this slow rate was almost certainly an artifact of the small volume of PFC used for each intrapulmonary exchange (~20 ml) and the small number of exchange (10 – 12 exchanges over 38 minutes). In fact, the cooling rate was faster in the animals in this study that were cooled externally by repeated application of ice water slush (0.17°C/min).
The most interesting result of this investigation were that MAP, mean PA pressure, HR, and CO, CBC and lactate of the LAPC treated animals were not significantly different than in the surface cooled animals. One variable that was altered in the LAPC group was an increase in pulmonary vascular resistance which appeared immediately after liquid loading and did not begin to return to baseline until halfway through the LAPC period. It is also remarkable that 1 animal in both the LAPC and the surface cooled groups (n = 7 for both groups) developed pulmonary hypertension and lethal pulmonary edema. The authors speculate that the observed pulmonary hypertension could have been a result of pulmonary venous constriction and/or increased pulmonary microvascular blood sludging due to the profound local cooling of lung vasculature resulting from instillation of 0°C PFC. They also raise the possibility that the observed elevation in PAP may have resulted from the mechanical effects of the PFC load; but offer no explanation for this.
Otherwise, hemodynamics were unaffected by LAPC. The paCO2 became progressively elevated during the hypothermic interval in the LAPC group, perhaps due to inadequate PEEP or inappropriate parameters of mechanical ventilation in the face of evaporating PFC (which was not replenished during the course of the experiments).
The second study to be published was by Ko, et al., in 2002.[273] The purpose of this study was to evaluate the effect of PLV on pulmonary blood flow under low blood flow conditions designed to simulate those encountered during CPR in order to further validate the use of LAPC as an adjunct to cardiopulmonary cerebral resuscitation. Isolated perfused rat lungs were subjected to 20 min of PLV with room temperature Perflubron™ and segmental (i.e. pre-capillary, capillary, and post-capillary) hemodynamics were studied at a perfusate flow rate of 6 ml/min (~5% normal cardiac output [274]). Lungs received either gas ventilation or 5 or 10 ml/kg PLV. Segmental pressures and vascular resistances were determined, as was transcapillary fluid flux. PLV at both the 5 and 10 ml/kg Perflubron™ dose produced no detectable changes in pulmonary blood flow or in transcapillary fluid flux and the investigators concluded that, “These data support further investigation of this technique as an adjunct to cardiopulmonary resuscitation.”
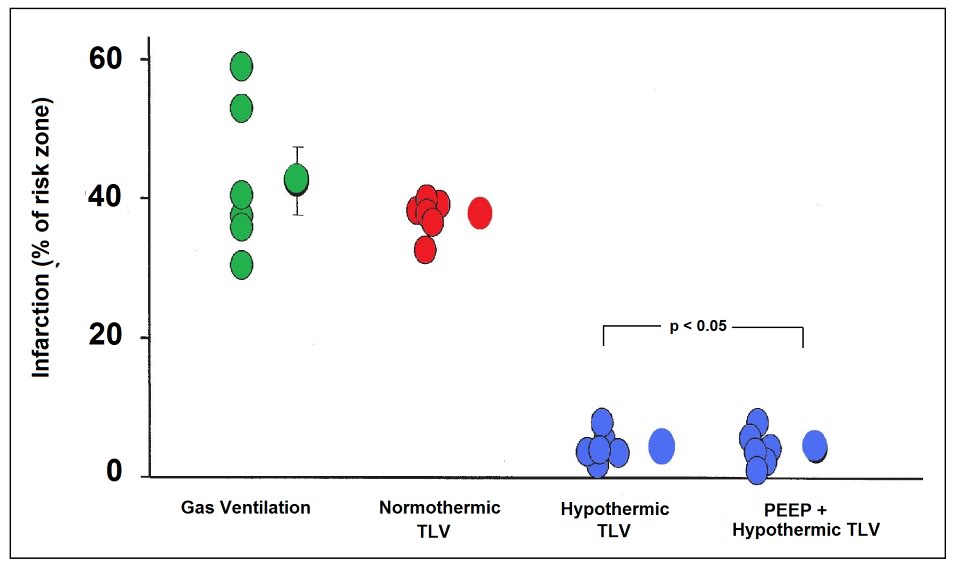
Figure 2-16: Dramatic reduction in myocardial infarction size in rabbits rapidly cooled to ~34 by the use of TLV LAPC: infarct volume was 4.0 ± 5% in the LAPC groups vs. 37.7 ± 1.3% in the normothermic gas ventilated group (p = 0.001). Redrawn from Tissier, et al.[275]
Unfortunately, this study did not explore the effect of instilling cold PFC into the lungs, nor did it employ FTLV. Because it was an ex vivo study it was not possible to determine the effects of PFC loading, cold or isothermic, on the sympathetic response, coronary blood flows or other physiological parameters of concern in LAPC.
In 2007 a study by Tissier, et al., [275] used a rabbit model of evolving MI to evaluate the efficacy of TLV LAPC administered during the ischemic interval in achieving rapid core cooling to reduce infarct size and provide myocardial protection [276],[277],[278] even after substantial delay [279] and when induced during reperfusion. [280],[281] It is well established that intra- and post-ischemic myocardial hypothermia dramatically reduces infarct size in animal models of MI and this observation has recently been extended to humans in the clinic.[282]
These investigators note that in the US the time to coronary revascularization following infarction is 120 min in 41.5% of patients admitted during off-hours and that 27.7% of patients presenting during normal business hours still averaged delays to revascularization in excess of 120 min.[283] Rapid induction of hypothermia in these patients could be effective in providing substantial myocardial salvage during the delay between presentation and revascularization. This study demonstrated a remarkable reduction in infarct size in the LAPC treated group; 4.0 ± 5% vs. 37.7 ± 1.3% in the normothermic, gas ventilated animals (p = 0.001). The cooling rate achieved with TLV was 1.32°C/min; 6.6°C in 5 minutes. The effectiveness of TLV LAPC is not consistent with results obtained in larger animals in this author’s experience. It may be that the relatively short distances between the large and small airways and the very small diameter of even the largest airways in the rabbit as compared with the dog or human, may have improved the efficiency of heat exchange.
The most recent study by Staffey, et al., [284] is more on-point and provides considerable reassurance that cold PFC loading of the lungs during CPR and subsequent resuscitation is not only not deleterious, but in fact is markedly beneficial. In this study swine were subjected to 11 min of VF and treated either with a static intrapulmonary infusion of PFC chilled to -12 C to ~75% of total lung volume (40 ml/kg), static infusion of isothermic PFC (33oC) under the same conditions, TLV with -15oC PFC at 6-cycles per minute during 10.5 minutes of the arrest interval, and a control group that was arrested with no intervention during the ischemic interval. The animal were then given AHA standard CPR with defibrillation and advanced cardiac life support (ACLS). The specific objectives of this study were to determine what the effects LAPC; tidal and static, administered during the period of cardiac arrest would be on hemodynamics, CPP, gas exchange, defibrillation, and hemodynamic stability during a 1 hour period of evaluation post ROSC. The endpoint was ROSC for 1 hour without ionotropic support.
The global objective of the study was to determine if LAPC could be used to rapidly induce cardiopulmonary hypothermia during the arrest period as opposed to cerebral or systemic hypothermia. Work by Rhee, et al., and Boddicker et al., also using swine models, had previously demonstrated that systemic hypothermia induced before resuscitation from cardiac arrest resulted in more rapid and consistent defibrillation from VF as well as earlier and more stable ROSC. Since the purpose of this study was to cool only the thoracic viscera to determine the effect of local cardiopulmonary hypothermia on resuscitation; ‘targeted cardiopulmonary intra-arrest moderate hypothermia (28-32oC),‘ LAPC was not continued beyond the period of cardiac arrest.
Both static and TLV LAPC succeeded in reducing the pulmonary artery temperature to the desired temperature of 34oC by 6 and 10 min post arrest, respectively. Eighty two percent of the animals in both LAPC groups were resuscitated successfully and survived the 1 hour evaluation period without pharmacological support, as contrasted with only 27% of the controls animals (p = 0.03). Interestingly, 73% of the isothermic TLV swine achieved and maintained ROSC as opposed to 27% of the swine in the control group (p = 0.09), suggesting that the presence of PFC in the lungs during either the arrest or resuscitation interval may improve the odds of successful defibrillation.
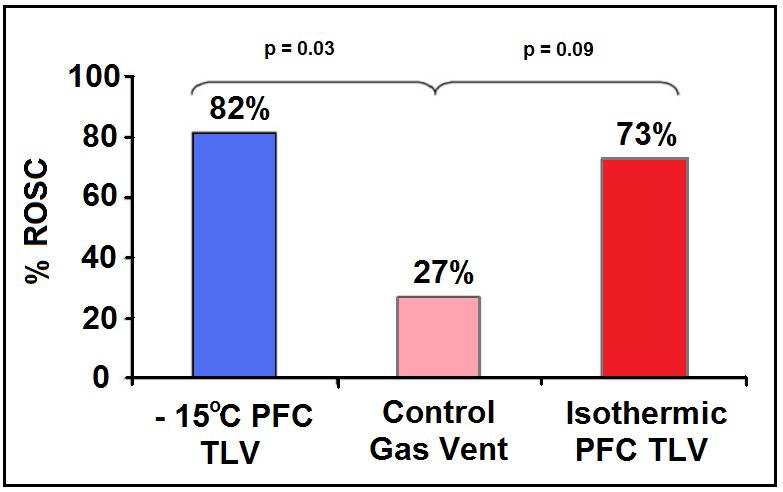
Figure 2-17: Results of the study by Staffey, et al., to evaluate the effect of cold and isothermic PFC infusion and TLV on resuscitability of swine after 11 min of electrically induced VF cardiac arrest. PFC loading, and in particular cold PFC loading or TLV improved 1 hour stable hemodynamic survival by 73% versus 27% in controls. Infusion of isothermic PFC to near vital capacity also showed a trend towards increased survival. Redrawn from Staffey, et al.,[284].
Chamberlain et al., have recently proposed that dilation of the right ventricle (RV) that occurs after the first ~5 min of cardiac arrest results in compression of the left ventricle (LV) within the confines of the pericardium. The effect of this would be to reduce myocyte stretch and reducing the contractile strength of the left ventricle in response to defibrillation (see discussion of the Frank-Starling curve above). They posit that an arrested heart that has a reduced contractile state, and in which left ventricular volume is reduced by the right ventricle over-distended with venous blood will not be able to initiate effective contraction even if coordinated electrical activity is restored. Distension of the RV occurs post-arrest due to centrally mediated sympathetic contraction of the vasculature, as well as movement of blood into the venous circulation as arterial and venous pressure equilibrate; this is a commonplace finding at both necropsy and autopsy in normovolemic subjects.
Unloading the RV prior to defibrillation results in an immediate improvement in successful ROSC independent of any known metabolic that might accrue from ~10 to ~15 sec of coronary perfusion that might also result. Chamberlain, et al., believes that it is the decompression of the left ventricle and restoration of a more physiologic morphology that facilitates or even enables defibrillation under these conditions. Instillation of a large volume of dense PFC may antagonize distension of the RV and prevent LV volume loss and compression of the LV to below the threshold required to established effective contractile activity in response to defibrillation. PFC to vital capacity (VC) should effectively preclude this post-arrest pooling of blood in the thoracic caval and pulmonary vessels and may act to preserve left ventricular morphology during prolonged cardiac arrest.
Especially encouraging findings from the Staffey, et al., study were the absence of any noticeable adverse hemodynamic impact from either isothermic PFC loading or from cold PFC loading or cold TLV. MAP, CVP, CPP, pH and blood gases were not statistically different between the four groups of animals in the study.
These four studies of LAPC aimed at answering questions bearing on the feasibility of LAPC in MI, SCA and CPR are very encouraging. They indicate that LAPC is being seriously considered as a potential therapeutic application in humans. That this research is being undertaken in independent academic and medical research both in the US and elsewhere is especially heartening and would seem to indicate that the enormous therapeutic potential of LAPC-induced hypothermia has been successfully communicated.
6. Conclusions
LAPC is capable of inducing hypothermia in a fraction of the time that it takes to prepare a patient for cooling via CPB. In addition, automated LAPC need not have the spatial and technical restrictions of the hospital setting. Although relatively simple methods of continuous arterio-venous shunt heat-exchange that do not require a blood pump or carry the most of the risks attendant to CPB have been described which might be potentially applicable in the field [285], these techniques also have the drawback of requiring skilled personnel for cannulation of a major artery and vein. Intracaval heat exchange catheters can reduce core temperature, but only at rates of ~1.46 ± 0.42°C/h [286]; far too slowly to achieve the maximum benefit from post-reperfusion hypothermia
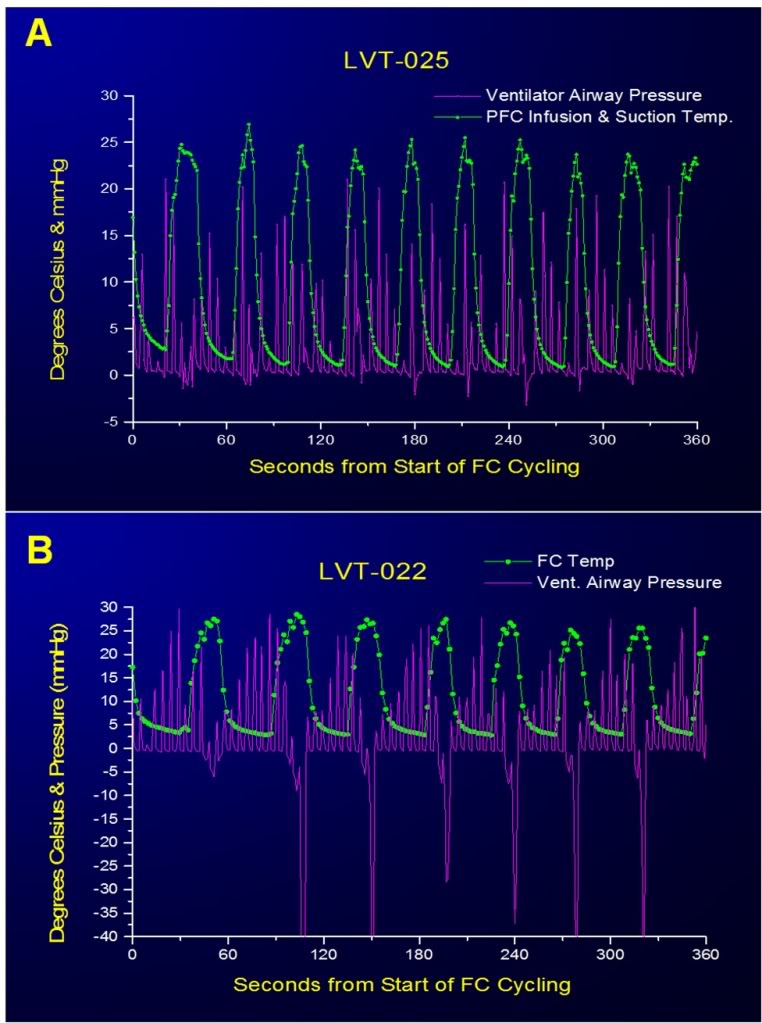
Figure 2-18: Large negative excursions in airway pressure occurred during suctioning of PFC at the end of most FTLVs when this operation was carried out manually (A). This occurred because when the PFC suction catheter was no longer filled with PFC, evacuation of gas from the airways occurred very rapidly owing to the much lower viscosity of gas compared to PFC. It was impossible for the operator to anticipate when the last of the bulk liquid would be removed, or to react rapidly enough when this occurred. Computerized sensing and control eliminated this potential source of baro-injury (B).
By contrast, LAPC may be a candidate for a much wider range of emergency field-uses in civilian and military settings since the primary technical skill required to initiate LAPC in the field is endotracheal intubation; a skill possessed by paramedical personnel throughout Canada, the U.S. and Europe. LAPC has also potential as a very rapid treatment for heatstroke and malignant hyperthermia. While not the subject of this report, LAPHE clearly also holds promise for core rewarming in severe hypothermia, although an absolute maximal PFC temperature of 42°C would in theory limit the re-warming rate to about one-third of that possible in cooling.
Computer control of both gas and FTLVs is effective at eliminating excessive positive and negative airway pressures during LAPC (Figure 2-16) and computer control can easily be extended to encompass cooling rate, depth, and duration and can also be extended to control gas ventilation, as necessary.
Whether used inside or outside hospital, successfully implemented LAPC might more generally serve as a neuroprotective bridge [287] in order to gain time for more technically sophisticated supportive or definitive treatment (e.g. neurovascular thrombolysis or interventional thrombectomy, emergency CPB, spinal cord decompression or definitive management of hemorrhagic shock in trauma or surgery).
Although some modalities of liquid ventilation have been clinically evaluated [288], the safety parameters of rapid and cold liquid delivery to the lungs remain to be determined. As noted in this study, LAPC can cause pulmonary injury. The mechanism of such damage suggest by the location of lesions indicates that both barotrauma (dependent lung) and volu-trauma (nondependent lung) are the primary, if not the sole factors. It has been observed that LAPC causes little permanent lung injury in long term survival animals. Similar pathology seen in lungs exposed to either isothermic or ~4ºC LAPC in the present study (data not shown) suggest that thermal/chilling-injury per se is not the major insult. Although more subtle biochemical and immune problems secondary to hypothermia itself are suggested by reports from some longer duration studies of MTH (pneumonia and sepsis), it is not clear that the short duration of treatment necessary to achieve the benefit of post-resuscitative MTH will pose such problems. It is hypothesized that the pulmonary injury observed in LAPC may be reduced with better control of LAPC pressure and volume limits, and by use of PFC liquids having more physiologically suitable properties.
A significant, unresolved concern is the potential negative impact of LAPC on myocardial perfusion and the danger of overcooling the heart during the low flow conditions of CPR with possible adverse effects on achieving ROSC and maintaining a stable rhythm following defibrillation. As already noted, these questions can only be resolved with further study.
Acknowledgements
The authors thank Saul Kent and William Faloon for support, and Casey Brechtel for helpful discussions. Several of the authors have applied for LAPC device patents. This trial was funded by a grant from the Life Extension Foundation (Hollywood, FL).
Appendix A
(The abbreviations contained in this appendix are also reproduced in the table of abbreviations and acronyms at the beginning of this document.)
A.1. Abbreviations and notation
In the text, volumes (V) are given in ml/kg, and flows (dV/dt =V’= ˙V ) in ml/kg per min. Since all V and ˙V are expressed in mass-specific (per kg animal) terms, derived quantities DQ and Cm are automatically mass-specific. Cm and Cvf are given in calories / (g or ml) per °K for easy comparison with water.
PFC = perfluorochemical; hydrogen-free organic molecule in which most of the peripheral atoms are fluorine.
TLV = tidal liquid ventilation is a modality in which liquid completely fills the lungs and ventilator.
PLV = partial liquid ventilation is a modality in which all gas exchange is via gas ventilation, with ~1/2 FRC of PFC liquid present in the lungs to recruit dependent lung in ALI or ARDS.
LAPC = liquid assisted pulmonary cooling is a heat-exchange modality in which ventilation occurs via both gas and liquid ventilation proceeding concurrently.
Ttym = tympanic temperature
Tart = arterial temperature
Tven = central venous temperature
Trec = rectal temperature
DTenet DTtymp = resulting from LAPC, after equilibration at t=40 min
TFTLV = FTLV cycle infusion time
ts = FTLV cycle suction time
tc = FTLV cycle period (=tinftc +ts)
VFTLV = single-cycle PFC FTLV infusion volume=tinf V_ inf
VS = single-cycle PFC FTLV suction-return volume
VD = ventilatory dead space (any type)
VDCA = expected gas ventilation VD=sum of circuit (mechanical) VD plus anatomic VD
VDTherm = thermal or heat-exchange VD (ml/kg, in reference to liquid PFC infusion)
˙V inf = PFC infusion rate (set to _50 ml/kg per min in Trials I and II)
˙VFTLV = effective PFC FTLV rate=LAPC liquid FTLV minute-ventilation (ml/kg per min) = VFTLV/ tc
˙Vg = gas minute-ventilation (ml/kg per min) m animal mass Ch heat capacity
CT = total heat capacity of the animal (= mCm)
m = mean mass-specific heat capacity of the animal ( = DQT / DTe)
Cvf = volume-specific heat capacity of FC-75 (mean of 0 and 25°C values) = 0.45 cal/ml per °K
DQT = total heat removed during LAPC (kJ/kg animal) = S DQc
DQc = heat removed during one FTLV cycle?????
Ef = mean cycle heat transfer efficiency=mean of [DQc / (theoretic DQc (max)] for all cycles in a single experiment
n = number of FTLV cycles in LAPC experiment
S = sum entire quantity following, for all cycles i = 1 through n
Tinf = PFC infusion temperature
TS = PFC suction removal temperature (time-averaged PFC suction flow temperature)
TSM= PFC mixed suction return-volume temperature (temperature of mixed VS)
A.2. Thermal kinetics
During LAPC cooling and equilibration, the blood and tympanic temperature changes in the animals were modelled by a simple five compartment model (Figure 2-8). During the initial ~100 s of LAPC (value used as empiric time mark), full development of heat-exchange behavior is established between the lungs, blood volume, and the thermal core of the animal, as suggested by the characteristic half-times for equilibration of these systems (see below).
Modelling of cooling during LAPC:
After the initial ~100 s of cooling, the data for tympanic DT(t) = DTtym during LAPC in Trial I and II were modelled by a single time-constant exponential decline.
Mean DTtym data for each trial from times t=100 to 1080 s were fit using (Eq. (1)).
DT (t) = T100 + DTk [1− exp (−t / to) ],
DT(t), total Ttym change from baseline Ttym at start of LAPC; t, =time in seconds after empiric time mark, 100 s after start of LAPC; T100, observed DT at empiric time mark, 100 s after start of LAPC; DTk, observed temperature-interval constant, specific to each LAPC method; to, observed natural-base time-constant, in sec (to = halftime / ln 2).
Best-fit values for Trial I data were: T100 = −0.52 ± 0.02°C; DTk = −11.2 ± 0.02°C; and to = 1064 ~3 s. Trial II values were T100 = −0.24 ± 0.02°C; DTk = −8.14 ± 0.02°C; and to = 1107 ± 5 s. The relatively long time-constant associated with this thermal phase, which was similar in the two trials, presumably reflects the long time-constant (~700 s, see below) associated with heat transfer from the thermal core of the animal to the thermal periphery; thus the exponential phase represents full development of heat exchange between the LAPC cooling device and the entire animal. The final linear segments of cooling occurring after this phase, measured at −0.29°C/min (Trial I) and −0.21°C/min(Trial II), represent the final relatively simple state which exists after heat exchange equilibrium between cooling device and animal has been fully established.
Cooling in blood and tympanic sites during LAPC, and thermal evolution in these sites during equilibration phase after LAPC was discontinued, was in accordance with a five-compartment thermal model (Figure 2-8). In this model, the tissues of the animal are divided into three thermal compartments, corresponding loosely with the vascular system, the thermal core, and the thermal periphery.
Modelling of equilibration after LAPC:
Perfusion-driven convection is the major heat transfer mechanism in very rapid systemic cooling processes. This fact allowed Tart and Tven changes to be used to quantify some features of heat transfer between body thermal compartments during the equilibration period after LAPC. The mean Tart curve in Trial I increased nearly linearly (R2 = 0.9976) for 12 s after the end of LAPC, rising at a rate of 7.9°C/min. After this initial 12 s, Tart departed from linearity (Figure 2-6 inset), and was modelled by the sum of three exponential terms with respective time constants (t0) of 12 ± 0.4, 102 ± 2 and 701 ± 8 s. These t0 times differed to a large enough extent that their respective influences could be considered to be controlling over discrete time periods of about twice their value. Thus, the four equilibration phases seen after the end of LAPC lasted approximately 12, 24, 200, and 1400 s (23 min), respectively and represented 34, 14, 25, and 27% of the 5.1°C rise in Tart during equilibration after LAPC.
These data may be interpreted as follows: during each phase of the equilibration process, one or more thermal compartments in the animal equilibrated with the next-most closely-connected compartment (Figure 2-8). Afterwards, the newly captured compartment(s), as part of a larger unit bound together by blood mediated convection, equilibrated with the next-most closely connected compartment, and so on. The 12 s linear first equilibration phase (Figure 2-7, inset) most likely represents development of heat transfer from the lungs to local pulmonary blood flow. This phase was not associated with blood recirculation since it was seen as a rise in Tart but not Tven. The second equilibration phase (duration ~24 s) was characterized by an increase in dTven / dt to the value of dTart /dt, indicating that the lungs, blood-volume, and certain other well-perfused viscera, such as the kidneys, were now evolving into a single thermal system. Since the observed to for this phase was 12 s, less than the animal’s mean circulation time (= cardiac output / blood volume ~30 s), this process appeared to be driven by blood circulation via the most rapid paths (e.g. renal circulation). Such short paths for circulatory heat transfer were evident in the relatively small lag times (10.4 ± 6.9 s) noted between Tart and Tven changes in these animals.
During the first two equilibration processes, the pulmonary circulation added thermal potential to the blood-volume more rapidly than it could be removed by the systemic circulation. By the end of the second equilibration phase, however, lung-to-blood heat transfer no longer dominated, and the gap between Tart and Tven was set by the magnitude of heat transfer from the circulating blood volume to the tissues that comprise the ‘thermal core’ of the animals. In this third equilibration phase (duration ~200 s), the viscera and blood-volume, as a unit, equilibrated with the remainder of the ‘well-perfused’ tissues of the body (thermal core, comprising about 70% of the animal’s heat capacity). Heat capacities for thermal compartments are calculated below. The to for this process is seen most directly in the ~2 min. delay between maximal DTven and maximal DTtym (Figure 2-7).
Finally, heat transfer within well-perfused tissues fell to a new minimum, and the Tart to Tven gap decreased to a value set by the fourth equilibration phase (duration ~23 min) during which the well-perfused tissues equilibrated, as a unit, with a succession of the more poorly-perfused compartments, e.g. gut contents, fat, and other tissues comprising the thermal ‘periphery’ [12]. These processes could be consolidated into a single exponential term. Due to the long time-scale, heat transfer during phase four was probably partly conductive. Estimates of basal metabolism in the anesthetized, non-shivering dog (@90 J/kg per minute) indicate that as much as 0.6°C of warming per 20 min in this model may be due to metabolism.
A.3. Thermal accounting
Heat transfer efficiency:
Although machine-LAPC allowed 2.3 times the FTLV frequency of the manual method, and resulted in a larger ˙VFTLV by a factor of 1.2, the cooling magnitudes and rates for machine-LAPC significantly (P < 0.001) fell short of those obtained with manual-LAPC (Fig. 3). The strategy of increasing FTLV frequency (1/tc) and decreasing ˙VFTLV, in order to arrive at approximately the same FTLV rate (˙VFTLV), therefore, significantly decreased the fraction of thermal potential which was transferred from each FTLV (= heat transfer efficiency, Ef). Unexpectedly, when the Ef for each of the 8 LAPC cooled animals of Trials I and II (Table 2) was calculated using (Eq. (2)), the value did not differ (P = 0.46) between trials; nor did total heat removed per kg (DQT), as calculated using (Eq. (3)), differ (P=0.14) between Trials. Both of these quantitative methods were therefore inaccurate for some dogs. Calculation of whole-animal mass-specific heat capacities Cm (= DQT / DTe) suggested that the Trial II values of ~DQT and Ef principally were inaccurate, since the mean Cm value of 0.70 ± 0.1 cal/g per °K for Trial I was consistent with the Cm reported in the literature for mice and humans [289], whereas Cm values calculated for Trial II using (Eq. (2)) were unrealistic, being greater than the Cm of water.
Ef (method 1) = 1/nS (TS−Tinf) / (Tven−Tinf), (2)
DQT (method 1) = ˙VFTLV Cvf STS−Tinf. (3)
To independently check the accuracy of Trial I values, we computed DQT and Cm for three dogs from an earlier study (Tables 1 and 2: dogs A, B, and C) that had been given ~4ºC PFC with FTLV times sufficiently long to allow the volumes and mixed-temperatures of suction-return liquid to be measured for each FTLV.
This allowed computation of DQT and Ef by a more detailed method (Method 2, Eqs. (4) and (5)), which used the extra thermal data (not available for Trials I and II) to more directly estimate FTLV heat transfer.
DQT (method 2)
= Cvf S VFTLV (Tven−Tinf) − VS (Tven−TSM), (4)
When this was done, the mean Cm for dogs A, B, and C was found to be 0.68 ± 0.06 cal/g per °K, consistent with the Cm in Trial I (P=0.80). Method 1 (Eqs. (2) and (3)) required the assumptions that PFC suction volume equalled infusion volume, that suction flows remained constant, and that thermal hysteresis was negligible. These assumptions apparently held true at the larger ˙VFTLV and tc values of Trial I, but not for the smaller values of Trial II.
With this information, a new Ef for Trial II was estimated using method 3 (Eq. (6)), which employed an estimate for the heat required for the observed DTe, vs. the total PFC thermal-deficit theoretically available.
This estimate required a presumed value of Cm. However, if the mean Trial II Cm was assumed to be the same as that of Trial I, then the true Trial II Ef could be calculated (Eq. (6)) to be 0.40 ± 0.06.
This value agreed with the rough estimation that since Trial II achieved only 73% of the DTe of Trial I, despite using 1.19 times more total PFC (Table 1), the
Ef in Trial II was expected to be about 73%/1.19 = 61% that of Trial I.
Thermal compartment size:
Heat removal for each cycle (DQc) in Trial I was calculated from the individual terms of Eq. (3), and individual-cycle mean cooling power calculated as DQc/tc. The latter parameter was useful since thermal compartments in the dog are relatively isolated at short time scales (Figure 2-8), and thus the ratio of cooling-power to cooling rate (Eq. (7)) at a given probe site was expected to give the heat capacity (Ch) of the system of thermal compartments that were in equilibrium with each other, and with the site, at the time of the measurement:
Ch (Comp N), total heat capacity of thermal compartments N = 2 + 3, or N = 2 + 3 + 4.
Both tc and dT/dt values were chosen at a time t, of interest when compartment system N has not yet equilibrated with slower half-time compartment(s). Thus, in
Trial I, near the end of FTLV cycle c1 (t = 30 s), the FTLV thermal-deficit had equilibrated within thermal Compartments 2 + 3 (PFC/viscera/blood-volume), but had not yet significantly reached Compartments 4 or 5.
If the cooling rate of Tven at t = 30 s (−1.9 ± 0.8°C/min) was then taken as the cooling rate of the system of PFC/viscera/blood-volume, the Ch for this compartment system could be estimated from (Eq. (7)) as 20 ± 9% of CT, the total heat capacity of the animal (CT = m Cm). Subtracting the Ch contribution of lung PFC (=m ˙VFTLV Cvf) allowed estimation of the remaining tissue Ch for Compartment 3 as ~19 ± 9% of CT.
Similarly, the Ch of Compartments 2, 3, and 4 together, was estimated at t = ~140 s (cycle 4) as 71 ± 17% of CT, corresponding to the classical whole-body ‘thermal core.’ The Compartment 5 Ch was then calculated to be the remainder (100−71%) = 29 ± 17% of CT, corresponding to the classical ‘thermal periphery.’
[1] In fact, a bag-valve ventilator can be effectively used to carry out LAPC.
[2] FTLV causes the CVP to oscillate and as a consequence to take on a pulsatile character so discussion of the CVP under these conditions must be in terms of the mean CVP..
[3] Perhaps the most lucid explanation of the hemodynamics of the lung pump theory was that given by its originator’s, Wiesfeldt and Chandra in their paper proposing the idea. That explanation is reproduced as Appendix B.
